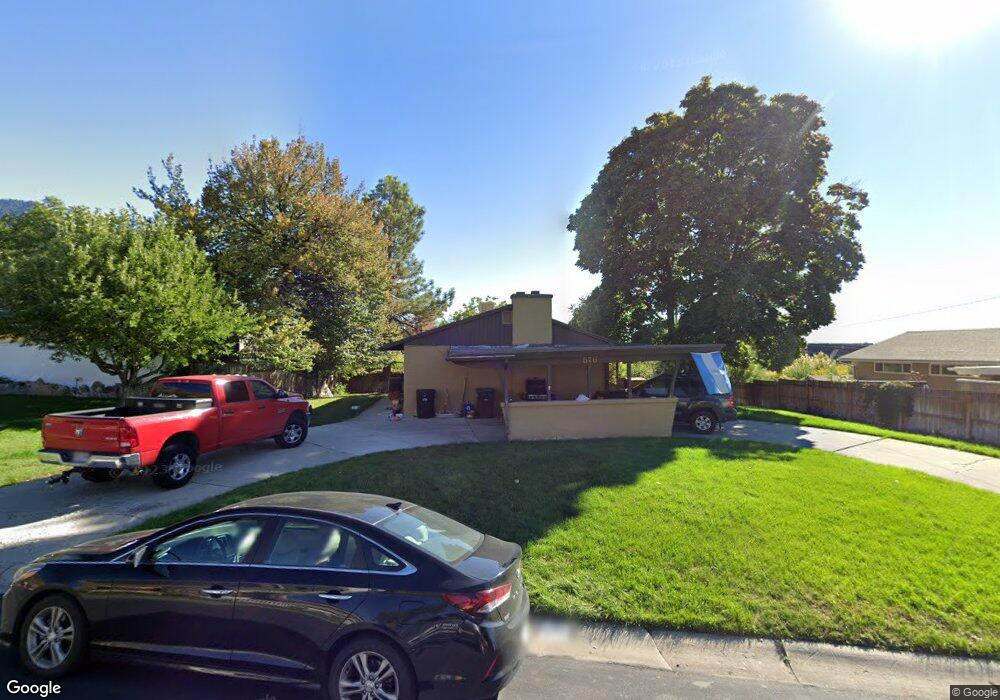
576 E 4300 N Provo, UT 84604
Rock Canyon NeighborhoodEstimated Value: $545,000 - $596,454
2
Beds
2
Baths
2,700
Sq Ft
$210/Sq Ft
Est. Value
About This Home
This home is located at 576 E 4300 N, Provo, UT 84604 and is currently estimated at $566,818, approximately $209 per square foot. 576 E 4300 N is a home located in Utah County with nearby schools including Canyon Crest Elementary School, Centennial Middle School, and Timpview High School.
Ownership History
Date
Name
Owned For
Owner Type
Purchase Details
Closed on
Mar 29, 2012
Sold by
Wadsworth Mark A and Wadsworth Kethleen R
Bought by
Wadsworth Mark A and Wadsworth Kathleen R
Current Estimated Value
Home Financials for this Owner
Home Financials are based on the most recent Mortgage that was taken out on this home.
Original Mortgage
$120,000
Interest Rate
3.83%
Mortgage Type
New Conventional
Purchase Details
Closed on
Mar 21, 2011
Sold by
Wadsworth Mark A and Wadsworth Kathleen R
Bought by
Wadsworth Mark A and Wadsworth Kathleen R
Purchase Details
Closed on
Sep 25, 2009
Sold by
Wadsworth Mark A and Wadsworth Kathleen Rae
Bought by
Wadsworth Mark A and Wadsworth Kathleen R
Home Financials for this Owner
Home Financials are based on the most recent Mortgage that was taken out on this home.
Original Mortgage
$123,900
Interest Rate
5.25%
Mortgage Type
New Conventional
Create a Home Valuation Report for This Property
The Home Valuation Report is an in-depth analysis detailing your home's value as well as a comparison with similar homes in the area
Home Values in the Area
Average Home Value in this Area
Purchase History
| Date | Buyer | Sale Price | Title Company |
|---|---|---|---|
| Wadsworth Mark A | -- | None Available | |
| Wadsworth Mark A | -- | None Available | |
| Wadsworth Mark A | -- | None Available | |
| Wadsworth Mark A | -- | Provo Land Title Company |
Source: Public Records
Mortgage History
| Date | Status | Borrower | Loan Amount |
|---|---|---|---|
| Closed | Wadsworth Mark A | $120,000 | |
| Closed | Wadsworth Mark A | $123,900 |
Source: Public Records
Tax History
| Year | Tax Paid | Tax Assessment Tax Assessment Total Assessment is a certain percentage of the fair market value that is determined by local assessors to be the total taxable value of land and additions on the property. | Land | Improvement |
|---|---|---|---|---|
| 2025 | $2,713 | $280,885 | -- | -- |
| 2024 | $2,713 | $267,025 | $0 | $0 |
| 2023 | $2,626 | $254,815 | $0 | $0 |
| 2022 | $2,636 | $257,895 | $0 | $0 |
| 2021 | $1,946 | $332,100 | $207,800 | $124,300 |
| 2020 | $1,845 | $295,100 | $173,200 | $121,900 |
| 2019 | $1,774 | $295,100 | $173,200 | $121,900 |
| 2018 | $1,684 | $284,100 | $162,200 | $121,900 |
| 2017 | $1,503 | $139,370 | $0 | $0 |
| 2016 | $1,380 | $119,295 | $0 | $0 |
| 2015 | $1,226 | $107,085 | $0 | $0 |
| 2014 | $1,020 | $92,895 | $0 | $0 |
Source: Public Records
Map
Nearby Homes
- 4161 N Canyon Rd Unit 2
- 299 E 4000 N
- 645 Foothill Dr
- 407 E 3900 Rd N Unit 1
- 407 E 3900 Rd N
- 4601 Foothill Dr
- 924 Redford Dr
- 981 Waterford Dr Unit 5&6
- 144 E 4620 N
- 3711 N Canyon Rd
- 3690 N Canyon Rd
- 285 Three Fountains Dr
- 3857 N 100 E
- 4299 Ivy Ln
- 4640 Brookshire Cir
- 3702 N 920 E
- 221 E 4735 N
- 3588 N 230 E
- 3943 Foothill Dr
- 1085 Windsor Dr
Your Personal Tour Guide
Ask me questions while you tour the home.