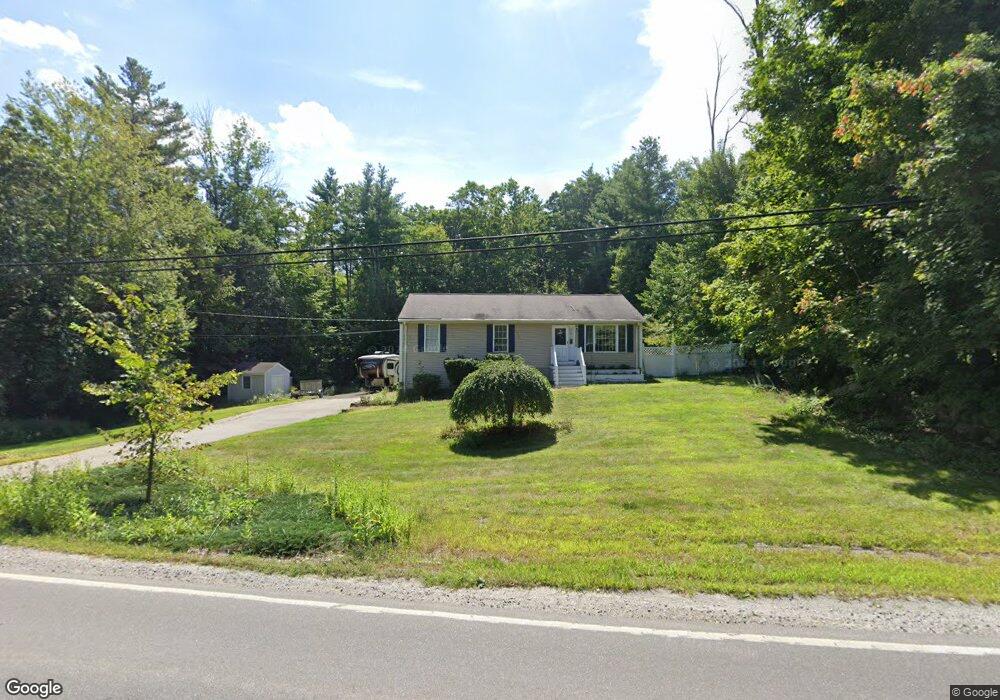
576 Main St Sandown, NH 03873
Estimated Value: $453,000 - $542,882
3
Beds
3
Baths
1,260
Sq Ft
$390/Sq Ft
Est. Value
About This Home
This home is located at 576 Main St, Sandown, NH 03873 and is currently estimated at $491,971, approximately $390 per square foot. 576 Main St is a home located in Rockingham County with nearby schools including Sandown North Elementary School, Timberlane Regional Middle School, and Timberlane Regional High School.
Ownership History
Date
Name
Owned For
Owner Type
Purchase Details
Closed on
Mar 1, 2023
Sold by
C & L Estates Llc
Bought by
Egbe Verkline
Current Estimated Value
Home Financials for this Owner
Home Financials are based on the most recent Mortgage that was taken out on this home.
Original Mortgage
$554,667
Outstanding Balance
$537,316
Interest Rate
6.15%
Mortgage Type
FHA
Estimated Equity
-$45,345
Purchase Details
Closed on
Mar 19, 2003
Sold by
Pmdf Builders Llc
Bought by
Driver Susan M
Home Financials for this Owner
Home Financials are based on the most recent Mortgage that was taken out on this home.
Original Mortgage
$125,000
Interest Rate
5.9%
Purchase Details
Closed on
Dec 17, 1996
Sold by
Amario Thelma I
Bought by
Dragon Richard J
Create a Home Valuation Report for This Property
The Home Valuation Report is an in-depth analysis detailing your home's value as well as a comparison with similar homes in the area
Home Values in the Area
Average Home Value in this Area
Purchase History
| Date | Buyer | Sale Price | Title Company |
|---|---|---|---|
| Egbe Verkline | $564,933 | None Available | |
| Driver Susan M | $232,900 | -- | |
| Dragon Richard J | $27,000 | -- | |
| Driver Susan M | $232,900 | -- | |
| Dragon Richard J | $27,000 | -- |
Source: Public Records
Mortgage History
| Date | Status | Borrower | Loan Amount |
|---|---|---|---|
| Open | Egbe Verkline | $554,667 | |
| Previous Owner | Dragon Richard J | $18,000 | |
| Previous Owner | Dragon Richard J | $137,000 | |
| Previous Owner | Dragon Richard J | $125,000 |
Source: Public Records
Tax History Compared to Growth
Tax History
| Year | Tax Paid | Tax Assessment Tax Assessment Total Assessment is a certain percentage of the fair market value that is determined by local assessors to be the total taxable value of land and additions on the property. | Land | Improvement |
|---|---|---|---|---|
| 2024 | $6,691 | $377,600 | $109,300 | $268,300 |
| 2023 | $7,892 | $377,600 | $109,300 | $268,300 |
| 2022 | $6,718 | $236,800 | $72,800 | $164,000 |
| 2021 | $6,862 | $236,800 | $72,800 | $164,000 |
| 2020 | $5,322 | $236,800 | $72,800 | $164,000 |
| 2019 | $6,384 | $236,800 | $72,800 | $164,000 |
| 2018 | $15 | $236,800 | $72,800 | $164,000 |
| 2017 | $15 | $195,700 | $61,400 | $134,300 |
| 2016 | $127 | $195,700 | $61,400 | $134,300 |
| 2015 | $5,213 | $195,700 | $61,400 | $134,300 |
| 2014 | $5,399 | $195,700 | $61,400 | $134,300 |
| 2013 | $5,300 | $195,700 | $61,400 | $134,300 |
Source: Public Records
Map
Nearby Homes
- 35 Royal Range Rd
- 35 Reed Rd
- 9 Scott Ln
- 37 Reed Rd
- 5 Lilac Ln
- 392 Fremont Rd
- 10 Raven Dr
- 21 Penacook Rd
- 30 Saw Mill Ridge
- 8 Eastfield Loop
- 61 Sargent Rd
- 44 Pheasant Run Dr
- Lot 6 Robin Way Unit 6
- Lot 6 Robin Way
- 209 Fremont Rd
- 27 Partridge Ln
- Lot 2 Robin Way Unit 2
- Lot 7 Robin Way Unit 7
- 335 Raymond Rd
- 53 Driftwood Cir Unit 20