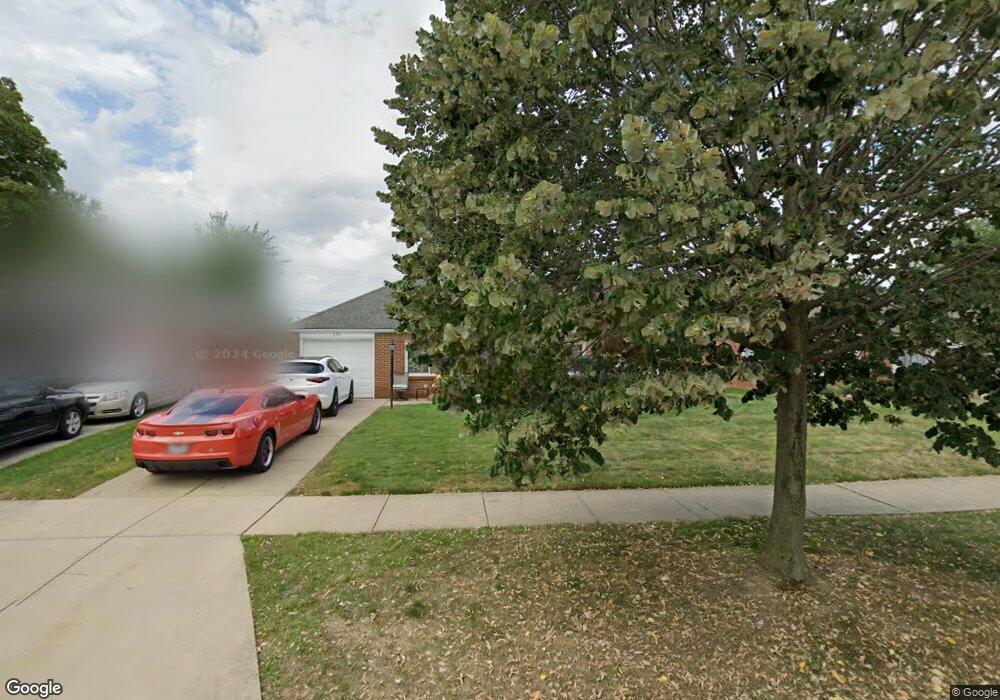
576 Sycamore Dr Euclid, OH 44132
Estimated Value: $154,480 - $201,000
3
Beds
2
Baths
1,423
Sq Ft
$121/Sq Ft
Est. Value
About This Home
This home is located at 576 Sycamore Dr, Euclid, OH 44132 and is currently estimated at $172,370, approximately $121 per square foot. 576 Sycamore Dr is a home located in Cuyahoga County with nearby schools including Shoreview Elementary School, Euclid High School, and Ss. Robert & William Catholic School.
Ownership History
Date
Name
Owned For
Owner Type
Purchase Details
Closed on
Aug 16, 2004
Sold by
Rajk John and Rajk Dana M
Bought by
Slaughter Kimberly M
Current Estimated Value
Home Financials for this Owner
Home Financials are based on the most recent Mortgage that was taken out on this home.
Original Mortgage
$90,155
Outstanding Balance
$52,916
Interest Rate
8.88%
Mortgage Type
Purchase Money Mortgage
Estimated Equity
$119,454
Purchase Details
Closed on
Mar 3, 1997
Sold by
Lobello Rose M
Bought by
Rajk John and Rajk Dana M
Home Financials for this Owner
Home Financials are based on the most recent Mortgage that was taken out on this home.
Original Mortgage
$72,597
Interest Rate
7.93%
Mortgage Type
FHA
Purchase Details
Closed on
Jun 5, 1984
Sold by
Lobello Frank T and Lobello Rose M
Bought by
Lebello Rose M
Purchase Details
Closed on
Jan 1, 1975
Bought by
Lobello Frank T and Lobello Rose M
Create a Home Valuation Report for This Property
The Home Valuation Report is an in-depth analysis detailing your home's value as well as a comparison with similar homes in the area
Home Values in the Area
Average Home Value in this Area
Purchase History
| Date | Buyer | Sale Price | Title Company |
|---|---|---|---|
| Slaughter Kimberly M | $94,900 | Barristers Title Agency | |
| Rajk John | $78,000 | -- | |
| Lebello Rose M | -- | -- | |
| Lobello Frank T | -- | -- |
Source: Public Records
Mortgage History
| Date | Status | Borrower | Loan Amount |
|---|---|---|---|
| Open | Slaughter Kimberly M | $90,155 | |
| Previous Owner | Rajk John | $72,597 |
Source: Public Records
Tax History Compared to Growth
Tax History
| Year | Tax Paid | Tax Assessment Tax Assessment Total Assessment is a certain percentage of the fair market value that is determined by local assessors to be the total taxable value of land and additions on the property. | Land | Improvement |
|---|---|---|---|---|
| 2024 | $3,543 | $51,625 | $9,940 | $41,685 |
| 2023 | $3,348 | $38,960 | $8,820 | $30,140 |
| 2022 | $3,271 | $38,955 | $8,820 | $30,135 |
| 2021 | $3,641 | $38,960 | $8,820 | $30,140 |
| 2020 | $3,054 | $29,510 | $6,690 | $22,820 |
| 2019 | $2,746 | $84,300 | $19,100 | $65,200 |
| 2018 | $2,772 | $29,510 | $6,690 | $22,820 |
| 2017 | $2,891 | $25,700 | $5,360 | $20,340 |
| 2016 | $2,897 | $25,700 | $5,360 | $20,340 |
| 2015 | $10,877 | $25,700 | $5,360 | $20,340 |
| 2014 | $10,877 | $25,700 | $5,360 | $20,340 |
Source: Public Records
Map
Nearby Homes
- 577 Sycamore Dr
- 559 Sycamore Dr
- 550 Sycamore Dr
- 546 Walnut Dr
- 27190 Shoreview Ave
- 27101 Zeman Ave
- 29038 Fuller Ave
- 461 E 271st St
- 26951 Shirley Ave
- 440 E 271st St
- 445 E 275th St
- 970 Bryn Mawr Ave
- 625 Lloyd Rd
- 712 E 266th St
- 415 E 266th St
- 26471 Shoreview Ave
- 26471 Farringdon Ave
- 26351 Farringdon Ave
- 780 E 266th St
- 369 E 270th St
- 580 Sycamore Dr
- 572 Sycamore Dr
- 568 Sycamore Dr
- 583 Hemlock Dr
- 591 Hemlock Dr
- 564 Sycamore Dr
- 588 Sycamore Dr
- 579 Hemlock Dr
- 571 Sycamore Dr
- 581 Sycamore Dr
- 567 Sycamore Dr
- 595 Hemlock Dr
- 583 Sycamore Dr
- 560 Sycamore Dr
- 592 Sycamore Dr
- 575 Hemlock Dr
- 587 Sycamore Dr
- 597 Hemlock Dr
- 588 Hemlock Dr
- 589 Sycamore Dr