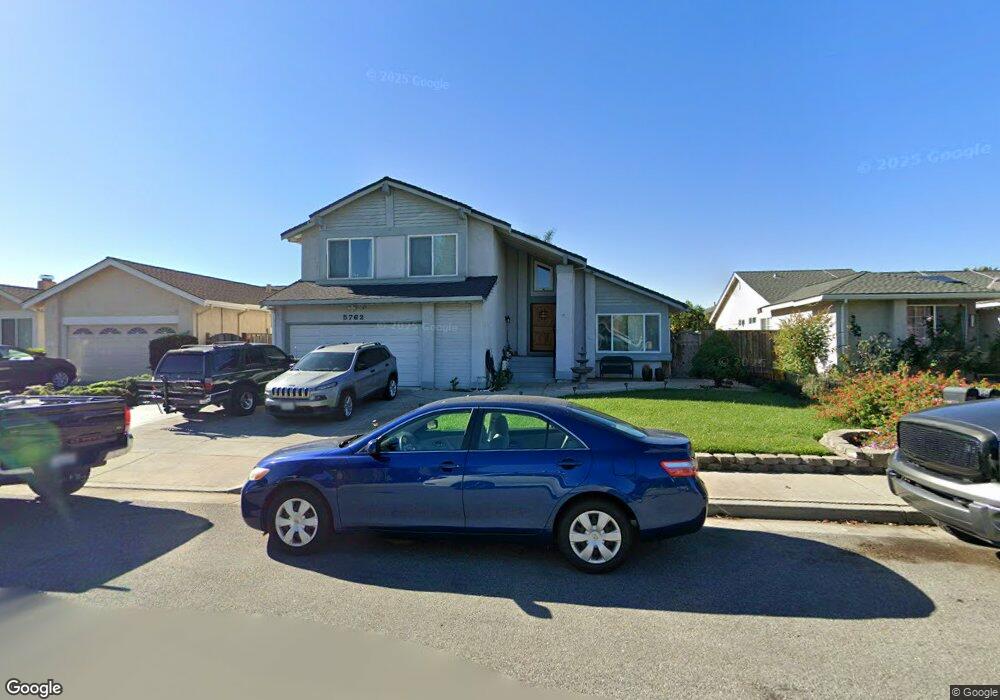
5762 Barnswell Way San Jose, CA 95138
Silver Leaf NeighborhoodEstimated Value: $1,332,086 - $1,635,000
4
Beds
3
Baths
1,987
Sq Ft
$743/Sq Ft
Est. Value
About This Home
This home is located at 5762 Barnswell Way, San Jose, CA 95138 and is currently estimated at $1,476,272, approximately $742 per square foot. 5762 Barnswell Way is a home located in Santa Clara County with nearby schools including Baldwin (Julia) Elementary School, Bernal Intermediate School, and Oak Grove High School.
Ownership History
Date
Name
Owned For
Owner Type
Purchase Details
Closed on
Dec 21, 2009
Sold by
Equity Builder Investment Group Llc
Bought by
Gonzales Ingnacio
Current Estimated Value
Home Financials for this Owner
Home Financials are based on the most recent Mortgage that was taken out on this home.
Original Mortgage
$547,893
Outstanding Balance
$355,160
Interest Rate
4.78%
Mortgage Type
FHA
Estimated Equity
$1,121,112
Purchase Details
Closed on
Sep 15, 2009
Sold by
Hernandez Miguel
Bought by
Equity Builder Investment Group Llc
Purchase Details
Closed on
Jul 11, 2005
Sold by
Branscombe Donald C and Branscombe Grace H A
Bought by
Hernandez Miguel
Home Financials for this Owner
Home Financials are based on the most recent Mortgage that was taken out on this home.
Original Mortgage
$547,500
Interest Rate
1%
Mortgage Type
Fannie Mae Freddie Mac
Create a Home Valuation Report for This Property
The Home Valuation Report is an in-depth analysis detailing your home's value as well as a comparison with similar homes in the area
Home Values in the Area
Average Home Value in this Area
Purchase History
| Date | Buyer | Sale Price | Title Company |
|---|---|---|---|
| Gonzales Ingnacio | $558,000 | Fidelity Title Company | |
| Equity Builder Investment Group Llc | $429,250 | None Available | |
| Hernandez Miguel | $730,000 | Chicago Title |
Source: Public Records
Mortgage History
| Date | Status | Borrower | Loan Amount |
|---|---|---|---|
| Open | Gonzales Ingnacio | $547,893 | |
| Previous Owner | Hernandez Miguel | $547,500 |
Source: Public Records
Tax History Compared to Growth
Tax History
| Year | Tax Paid | Tax Assessment Tax Assessment Total Assessment is a certain percentage of the fair market value that is determined by local assessors to be the total taxable value of land and additions on the property. | Land | Improvement |
|---|---|---|---|---|
| 2025 | $10,332 | $720,264 | $360,132 | $360,132 |
| 2024 | $10,332 | $706,142 | $353,071 | $353,071 |
| 2023 | $10,167 | $692,298 | $346,149 | $346,149 |
| 2022 | $10,097 | $678,724 | $339,362 | $339,362 |
| 2021 | $9,942 | $665,416 | $332,708 | $332,708 |
| 2020 | $9,722 | $658,594 | $329,297 | $329,297 |
| 2019 | $9,493 | $645,682 | $322,841 | $322,841 |
| 2018 | $9,427 | $633,022 | $316,511 | $316,511 |
| 2017 | $9,301 | $620,610 | $310,305 | $310,305 |
| 2016 | $8,852 | $608,442 | $304,221 | $304,221 |
| 2015 | $8,651 | $599,304 | $299,652 | $299,652 |
| 2014 | $7,914 | $587,566 | $293,783 | $293,783 |
Source: Public Records
Map
Nearby Homes
- 200 Ford Rd Unit 227
- 200 Ford Rd Unit 180
- 200 Ford Rd Unit 160
- 5736 Silver Leaf Rd
- 323 Flinder Place
- 426 Ellicott Loop
- 5480 Demerest Ln
- 158 Southsun Ct
- 44 Southmar Ct
- 5765 Magnetic Loop
- 6806 Chroma Ct
- 5886 Smoky Quartz Loop
- 5450 Monterey Hwy Unit 62
- 5450 Monterey Hwy Unit 54A
- 5450 Monterey Hwy Unit 164
- Plan 1 at Lotus at UrbanOak
- Plan 4 at Lotus at UrbanOak
- Plan 7 at Lotus at UrbanOak
- Plan 3 at Lotus at UrbanOak
- Plan 2 at Lotus at UrbanOak
- 5758 Barnswell Way
- 5766 Barnswell Way
- 5721 Sagewell Way
- 5770 Barnswell Way
- 5754 Barnswell Way
- 5719 Sagewell Way
- 5723 Sagewell Way
- 5717 Sagewell Way
- 5761 Barnswell Way
- 5765 Barnswell Way
- 5757 Barnswell Way
- 5774 Barnswell Way
- 5753 Barnswell Way
- 5727 Sagewell Way
- 5773 Barnswell Way
- 5778 Barnswell Way
- 73 Grandwell Way
- 94 Grandwell Way
- 5729 Sagewell Way
- 77 Grandwell Way