Estimated Value: $252,000 - $282,000
Studio
--
Bath
--
Sq Ft
14,549
Sq Ft Lot
About This Home
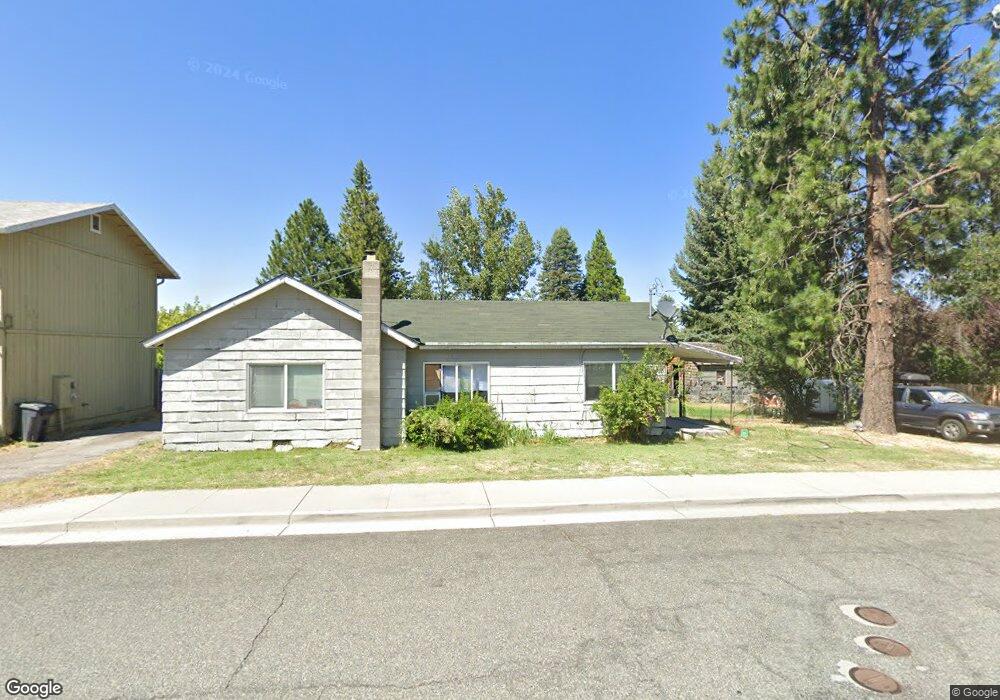
This home is located at 577 Walnut St Unit 579, Weed, CA 96094 and is currently estimated at $268,538. 577 Walnut St Unit 579 is a home located in Siskiyou County with nearby schools including Weed Elementary School, Weed High School, and Siskiyou Christian School.
Ownership History
Date
Name
Owned For
Owner Type
Purchase Details
Closed on
Aug 8, 2024
Sold by
Lalicker Aluxa
Bought by
Bramell Amir
Current Estimated Value
Home Financials for this Owner
Home Financials are based on the most recent Mortgage that was taken out on this home.
Original Mortgage
$199,500
Outstanding Balance
$197,238
Interest Rate
6.86%
Mortgage Type
New Conventional
Estimated Equity
$71,300
Purchase Details
Closed on
Aug 5, 2024
Sold by
Henley Robert Earl and Henley Rebekah
Bought by
Bramell Amir
Home Financials for this Owner
Home Financials are based on the most recent Mortgage that was taken out on this home.
Original Mortgage
$199,500
Outstanding Balance
$197,238
Interest Rate
6.86%
Mortgage Type
New Conventional
Estimated Equity
$71,300
Purchase Details
Closed on
Jun 20, 2014
Sold by
Carlisle Chester D and Carlisle Terri L
Bought by
Henley Robert Earl and Henley Rebekah
Home Financials for this Owner
Home Financials are based on the most recent Mortgage that was taken out on this home.
Original Mortgage
$179,784
Interest Rate
4.17%
Mortgage Type
VA
Create a Home Valuation Report for This Property
The Home Valuation Report is an in-depth analysis detailing your home's value as well as a comparison with similar homes in the area
Home Values in the Area
Average Home Value in this Area
Purchase History
| Date | Buyer | Sale Price | Title Company |
|---|---|---|---|
| Bramell Amir | -- | Mt Shasta Title | |
| Bramell Amir | $266,000 | Mt Shasta Title | |
| Henley Robert Earl | $176,000 | Mt Shasta Title & Escrow Co |
Source: Public Records
Mortgage History
| Date | Status | Borrower | Loan Amount |
|---|---|---|---|
| Open | Bramell Amir | $199,500 | |
| Previous Owner | Henley Robert Earl | $179,784 |
Source: Public Records
Tax History
| Year | Tax Paid | Tax Assessment Tax Assessment Total Assessment is a certain percentage of the fair market value that is determined by local assessors to be the total taxable value of land and additions on the property. | Land | Improvement |
|---|---|---|---|---|
| 2025 | $2,290 | $266,000 | $35,000 | $231,000 |
| 2023 | $2,290 | $207,364 | $31,808 | $175,556 |
| 2022 | $2,204 | $203,299 | $31,185 | $172,114 |
| 2021 | $2,167 | $199,314 | $30,574 | $168,740 |
| 2020 | $2,151 | $197,271 | $30,261 | $167,010 |
| 2019 | $2,109 | $193,404 | $29,668 | $163,736 |
| 2018 | $2,068 | $189,613 | $29,087 | $160,526 |
| 2017 | $2,033 | $185,896 | $28,517 | $157,379 |
| 2016 | $1,994 | $182,252 | $27,958 | $154,294 |
| 2015 | -- | $179,516 | $27,539 | $151,977 |
| 2014 | -- | $151,168 | $20,510 | $130,658 |
Source: Public Records
Map
Nearby Homes
- 216 College Ave
- 372 Walnut St
- 750 S Weed Blvd
- 202 - 206 N Weed Blvd
- 202 & 206 N Weed Blvd
- Lot 34 Glenhaven Ct
- Lot 32 Glenhaven Ct
- Lot 33 Glenhaven Ct
- .68 Acres Shastina Dr
- 1324 Alves Dr
- Lot 25 Meadow Ln
- Lot 26 Meadow Ln
- Lot 63 Hidden Meadow Dr
- Lot 27 Hidden Meadow Dr
- Lot 37 Hidden Meadow Dr
- Lot 29 Hidden Meadow Dr
- Lot 40 Hidden Meadow Dr
- Lot 50 Hidden Meadow Dr
- Lot 3 Hidden Meadow Dr
- Lot 62 Hidden Meadow Dr
- 577 and 579 Walnut St
- 577 579 Walnut
- 569 Walnut St
- 585 Walnut St
- 531 Walnut St
- 519 Walnut St
- 360 Siskiyou Way
- 580 Walnut St
- 275 Siskiyou Way
- 538 Walnut St
- 626 Walnut St
- 631 Walnut St
- 526 Walnut St
- 260 Siskiyou Way
- 491 Walnut St
- 363 Phelps Ave
- 561 Oregon St
- 591 Oregon St
- 230 Siskiyou Way
- 483 Walnut St
Your Personal Tour Guide
Ask me questions while you tour the home.