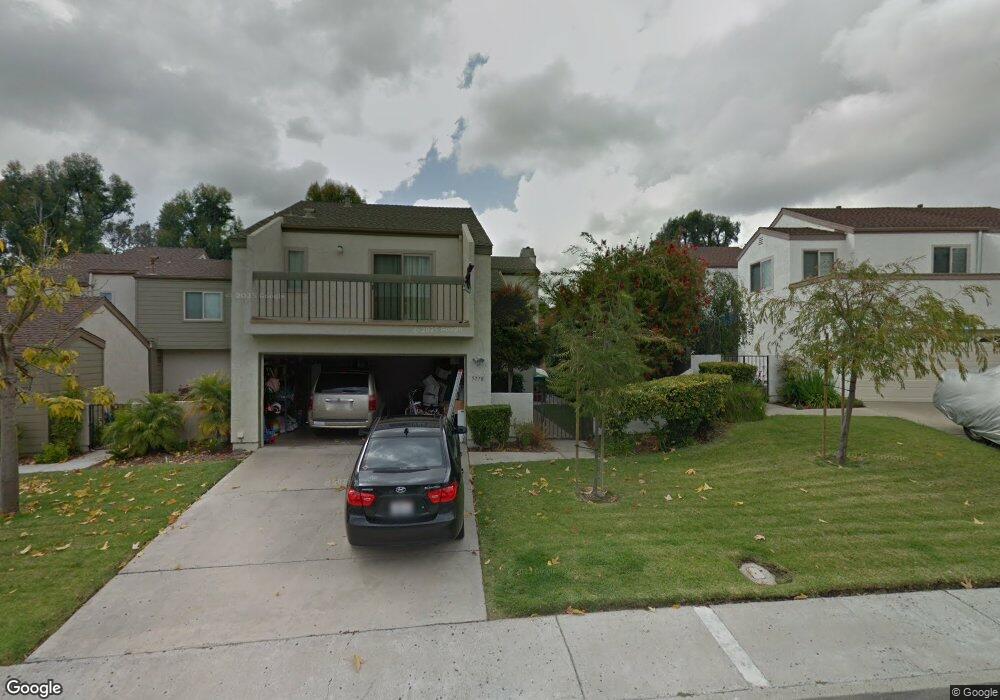
5778 Menorca Dr San Diego, CA 92124
Tierrasanta NeighborhoodEstimated Value: $1,003,000 - $1,034,528
3
Beds
3
Baths
1,840
Sq Ft
$557/Sq Ft
Est. Value
About This Home
This home is located at 5778 Menorca Dr, San Diego, CA 92124 and is currently estimated at $1,025,132, approximately $557 per square foot. 5778 Menorca Dr is a home located in San Diego County with nearby schools including Kumeyaay Elementary School, Farb Middle School, and De Portola Middle School.
Ownership History
Date
Name
Owned For
Owner Type
Purchase Details
Closed on
Jul 20, 2023
Sold by
Wilkerson Wendy A
Bought by
Wendy Wilkerson Declaration Of Trust and Wilkerson
Current Estimated Value
Purchase Details
Closed on
May 14, 1999
Sold by
Rosenstein Allen
Bought by
Rosenstein Sandra and Miltein Sandra
Purchase Details
Closed on
Feb 9, 1999
Sold by
Rosenstein Sandra and Milstein Sandra
Bought by
Wilkerson Donald A and Wilkerson Wendy A
Home Financials for this Owner
Home Financials are based on the most recent Mortgage that was taken out on this home.
Original Mortgage
$209,520
Interest Rate
6.94%
Purchase Details
Closed on
May 15, 1990
Purchase Details
Closed on
Aug 20, 1987
Purchase Details
Closed on
Jan 3, 1986
Purchase Details
Closed on
Oct 1, 1985
Create a Home Valuation Report for This Property
The Home Valuation Report is an in-depth analysis detailing your home's value as well as a comparison with similar homes in the area
Home Values in the Area
Average Home Value in this Area
Purchase History
| Date | Buyer | Sale Price | Title Company |
|---|---|---|---|
| Wendy Wilkerson Declaration Of Trust | -- | None Listed On Document | |
| Rosenstein Sandra | -- | Southland Title | |
| Wilkerson Donald A | $216,000 | Southland Title Of San Diego | |
| -- | $198,000 | -- | |
| -- | $140,000 | -- | |
| -- | $126,000 | -- | |
| -- | $128,000 | -- |
Source: Public Records
Mortgage History
| Date | Status | Borrower | Loan Amount |
|---|---|---|---|
| Previous Owner | Wilkerson Donald A | $209,520 |
Source: Public Records
Tax History
| Year | Tax Paid | Tax Assessment Tax Assessment Total Assessment is a certain percentage of the fair market value that is determined by local assessors to be the total taxable value of land and additions on the property. | Land | Improvement |
|---|---|---|---|---|
| 2025 | $4,469 | $367,029 | $128,984 | $238,045 |
| 2024 | $4,469 | $359,833 | $126,455 | $233,378 |
| 2023 | $4,366 | $352,778 | $123,976 | $228,802 |
| 2022 | $4,244 | $345,862 | $121,546 | $224,316 |
| 2021 | $4,209 | $339,081 | $119,163 | $219,918 |
| 2020 | $4,157 | $335,606 | $117,942 | $217,664 |
| 2019 | $4,081 | $329,027 | $115,630 | $213,397 |
| 2018 | $3,817 | $322,576 | $113,363 | $209,213 |
| 2017 | $80 | $316,252 | $111,141 | $205,111 |
| 2016 | $3,663 | $310,052 | $108,962 | $201,090 |
| 2015 | $3,607 | $305,396 | $107,326 | $198,070 |
| 2014 | $3,550 | $299,415 | $105,224 | $194,191 |
Source: Public Records
Map
Nearby Homes
- 5916 Portobelo Ct
- 6161 Calle Mariselda Unit 408
- 10386 La Duena Way
- 5848 Antigua Blvd
- 6128 Portobelo Ct
- 10847 Portobelo Dr
- 10690 Esmeraldas Dr
- 10226 Mirabel Ln
- 5137 Abuela Dr
- 11330 Camino Playa Cancun
- 11182 1/2 Portobelo Dr
- 10665 Escobar Dr
- 11386 Camino Playa Cancun Unit 7
- 4508 Calle de Vida
- 4390 Cartulina Rd
- 5059 La Cuenta Dr
- 9810 Guisante Terrace
- 9826 Guisante Terrace
- 5389 Caminito Velasquez Unit 183
- 10808 Valiente Ct
- 5784 Menorca Dr
- 5772 Menorca Dr
- 5764 Menorca Dr Unit 2
- 5790 Menorca Dr
- 5756 Menorca Dr
- 10585 El Comal Dr
- 10575 El Comal Dr
- 10555 El Comal Dr
- 5773 Menorca Dr Unit 2
- 10565 El Comal Dr
- 5748 Menorca Dr
- 5767 Menorca Dr
- 5781 Menorca Dr
- 5789 Menorca Dr Unit 2
- 5759 Menorca Dr
- 5740 Menorca Dr
- 5785 Avenida Sanchez
- 5797 Menorca Dr
- 5781 Avenida Sanchez
- 5791 Avenida Sanchez
Your Personal Tour Guide
Ask me questions while you tour the home.