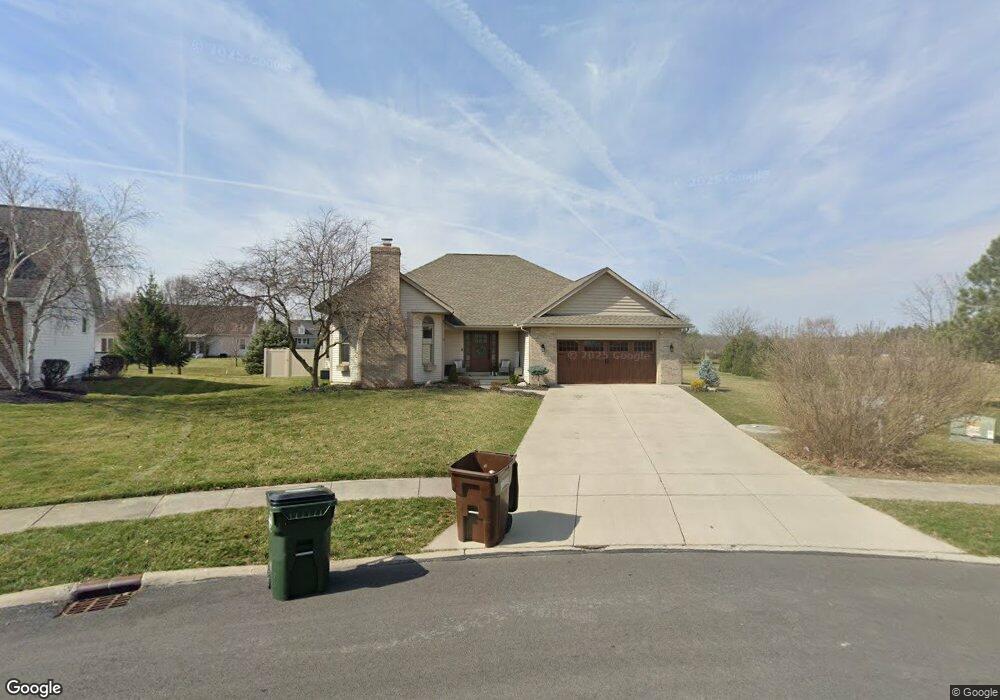
578 Hunters Run Bluffton, OH 45817
Estimated Value: $376,000 - $430,000
4
Beds
2
Baths
1,870
Sq Ft
$217/Sq Ft
Est. Value
About This Home
This home is located at 578 Hunters Run, Bluffton, OH 45817 and is currently estimated at $405,436, approximately $216 per square foot. 578 Hunters Run is a home located in Allen County with nearby schools including Bluffton Elementary School, Bluffton Middle School, and Bluffton High School.
Ownership History
Date
Name
Owned For
Owner Type
Purchase Details
Closed on
Apr 30, 2020
Sold by
Intagliata Stephen P and Intagliata Karen S
Bought by
Shoemaker Ryan D and Shoemaker Jori
Current Estimated Value
Home Financials for this Owner
Home Financials are based on the most recent Mortgage that was taken out on this home.
Original Mortgage
$337,250
Outstanding Balance
$300,512
Interest Rate
3.6%
Mortgage Type
Construction
Estimated Equity
$104,924
Purchase Details
Closed on
Jul 11, 2006
Sold by
Santos Clarence B and Santos Holly E
Bought by
Intagliata Stephen P and Intagliata Karen S
Home Financials for this Owner
Home Financials are based on the most recent Mortgage that was taken out on this home.
Original Mortgage
$218,975
Interest Rate
7.37%
Mortgage Type
Assumption
Purchase Details
Closed on
Jul 1, 1997
Sold by
Mathew Dale
Bought by
Santos Clarence
Purchase Details
Closed on
Mar 6, 1996
Sold by
Kimmet Donald
Bought by
Mathew Dale and Mathew Colleen
Create a Home Valuation Report for This Property
The Home Valuation Report is an in-depth analysis detailing your home's value as well as a comparison with similar homes in the area
Home Values in the Area
Average Home Value in this Area
Purchase History
| Date | Buyer | Sale Price | Title Company |
|---|---|---|---|
| Shoemaker Ryan D | $292,500 | None Available | |
| Intagliata Stephen P | $230,500 | None Available | |
| Santos Clarence | $165,000 | -- | |
| Mathew Dale | $19,500 | -- |
Source: Public Records
Mortgage History
| Date | Status | Borrower | Loan Amount |
|---|---|---|---|
| Open | Shoemaker Ryan D | $337,250 | |
| Closed | Intagliata Stephen P | $218,975 |
Source: Public Records
Tax History Compared to Growth
Tax History
| Year | Tax Paid | Tax Assessment Tax Assessment Total Assessment is a certain percentage of the fair market value that is determined by local assessors to be the total taxable value of land and additions on the property. | Land | Improvement |
|---|---|---|---|---|
| 2024 | $4,696 | $142,110 | $23,000 | $119,110 |
| 2023 | $3,617 | $101,510 | $16,420 | $85,090 |
| 2022 | $3,657 | $101,510 | $16,420 | $85,090 |
| 2021 | $3,681 | $101,510 | $16,420 | $85,090 |
| 2020 | $3,084 | $76,940 | $15,650 | $61,290 |
| 2019 | $3,084 | $76,940 | $15,650 | $61,290 |
| 2018 | $3,096 | $76,940 | $15,650 | $61,290 |
| 2017 | $3,097 | $76,940 | $15,650 | $61,290 |
| 2016 | $3,102 | $76,940 | $15,650 | $61,290 |
| 2015 | $3,395 | $76,940 | $15,650 | $61,290 |
| 2014 | $3,395 | $81,550 | $15,190 | $66,360 |
| 2013 | $3,151 | $81,550 | $15,190 | $66,360 |
Source: Public Records
Map
Nearby Homes
- 110 Magnolia Ln
- 222 N Lawn Ave
- 210 N Jackson St
- 106 Riley St
- 212 S Lawn Ave
- 0 Ohio 103
- 222 Grove St
- 217 Grove St
- 0 Columbus Grove-Bluffton Rd
- 513 S Jackson St
- 305 Parkview Dr
- 307 Parkview Dr
- 303 Parkview Dr
- 301 Parkview Dr
- 313 Parkview Dr
- 315 Parkview Dr
- 317 Parkview Dr
- 319 Parkview Dr
- 656 S Main St
- 321 Parkview Dr