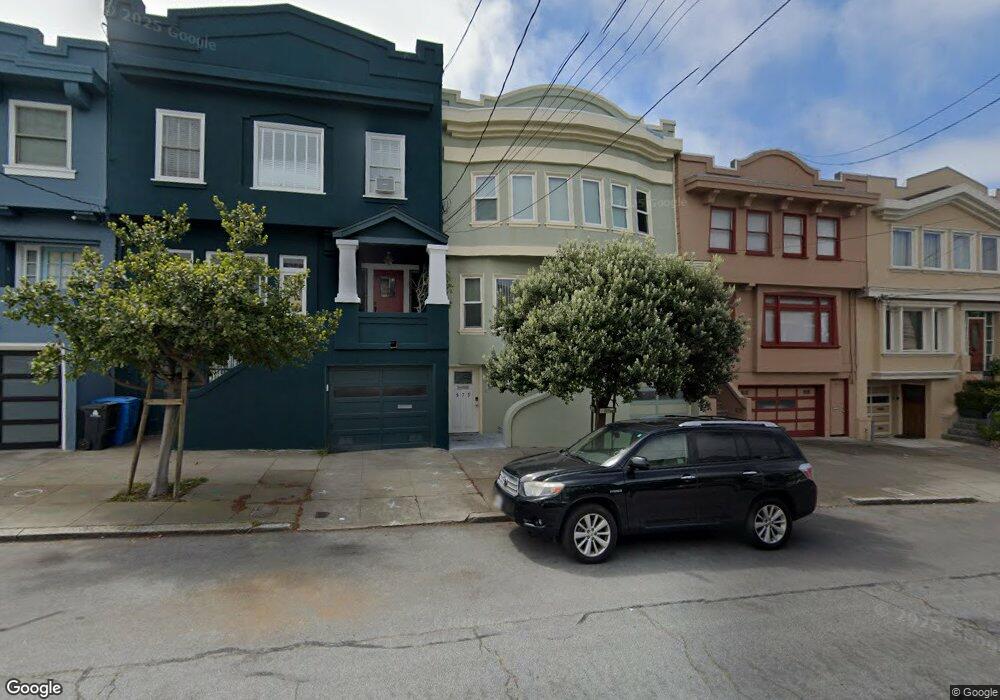
579 18th Ave San Francisco, CA 94121
Central Richmond NeighborhoodEstimated Value: $2,352,000 - $3,059,000
4
Beds
3
Baths
3,041
Sq Ft
$885/Sq Ft
Est. Value
About This Home
This home is located at 579 18th Ave, San Francisco, CA 94121 and is currently estimated at $2,691,487, approximately $885 per square foot. 579 18th Ave is a home located in San Francisco County with nearby schools including Argonne Elementary School, Presidio Middle School, and Stratford School - San Francisco 14th Avenue.
Ownership History
Date
Name
Owned For
Owner Type
Purchase Details
Closed on
Jan 7, 2009
Sold by
Yuan Jackson J and Chu Lynn
Bought by
Yuan Jackson J and Chu Lynn
Current Estimated Value
Purchase Details
Closed on
Jul 5, 2002
Sold by
Yuan Jackson and Chu Lynn
Bought by
Yuan Jackson and Chu Lynn
Purchase Details
Closed on
Feb 22, 2001
Sold by
Chu Linda
Bought by
Yuan Jackson and Chu Lynn
Purchase Details
Closed on
Jan 11, 2000
Sold by
Jackson Yuan and Lynn Chu
Bought by
Chu Linda
Purchase Details
Closed on
Jun 18, 1996
Sold by
Lowe Robert
Bought by
Yuan Jackson and Chu Lynn
Home Financials for this Owner
Home Financials are based on the most recent Mortgage that was taken out on this home.
Original Mortgage
$224,000
Outstanding Balance
$14,638
Interest Rate
8.25%
Estimated Equity
$2,676,849
Purchase Details
Closed on
Aug 21, 1995
Sold by
Ozene Willie Emma and Ozene George H
Bought by
Lowe Robert
Create a Home Valuation Report for This Property
The Home Valuation Report is an in-depth analysis detailing your home's value as well as a comparison with similar homes in the area
Home Values in the Area
Average Home Value in this Area
Purchase History
| Date | Buyer | Sale Price | Title Company |
|---|---|---|---|
| Yuan Jackson J | -- | None Available | |
| Yuan Jackson | -- | -- | |
| Yuan Jackson | -- | -- | |
| Chu Linda | $144,500 | -- | |
| Yuan Jackson | $280,000 | Fidelity National Title Co | |
| Lowe Robert | $48,416 | -- |
Source: Public Records
Mortgage History
| Date | Status | Borrower | Loan Amount |
|---|---|---|---|
| Open | Yuan Jackson | $224,000 |
Source: Public Records
Tax History Compared to Growth
Tax History
| Year | Tax Paid | Tax Assessment Tax Assessment Total Assessment is a certain percentage of the fair market value that is determined by local assessors to be the total taxable value of land and additions on the property. | Land | Improvement |
|---|---|---|---|---|
| 2025 | $8,667 | $752,090 | $184,543 | $567,547 |
| 2024 | $8,667 | $737,347 | $180,926 | $556,421 |
| 2023 | $8,542 | $722,892 | $177,379 | $545,513 |
| 2022 | $8,389 | $708,720 | $173,901 | $534,819 |
| 2021 | $8,244 | $694,825 | $170,492 | $524,333 |
| 2020 | $8,269 | $687,703 | $168,744 | $518,959 |
| 2019 | $7,985 | $674,221 | $165,436 | $508,785 |
| 2018 | $6,165 | $477,003 | $162,193 | $314,810 |
| 2017 | $4,965 | $397,064 | $159,014 | $238,050 |
| 2016 | $4,860 | $389,280 | $155,897 | $233,383 |
| 2015 | $4,797 | $383,434 | $153,556 | $229,878 |
| 2014 | $4,670 | $375,925 | $150,549 | $225,376 |
Source: Public Records
Map
Nearby Homes
- 1608 Balboa St
- 1532 Cabrillo St
- 1633 Cabrillo St
- 609 15th Ave
- 516 15th Ave Unit 518
- 518 15th Ave
- 756 18th Ave Unit 756
- 2133 Balboa St
- 428 15th Ave
- 1827 Clement St
- 700 12th Ave Unit 6
- 368 Funston Ave
- 459 11th Ave
- 2205 Clement St
- 1940 Anza St Unit 6
- 880 26th Ave Unit 5
- 576 27th Ave
- 172 18th Ave
- 511 9th Ave
- 874 27th Ave