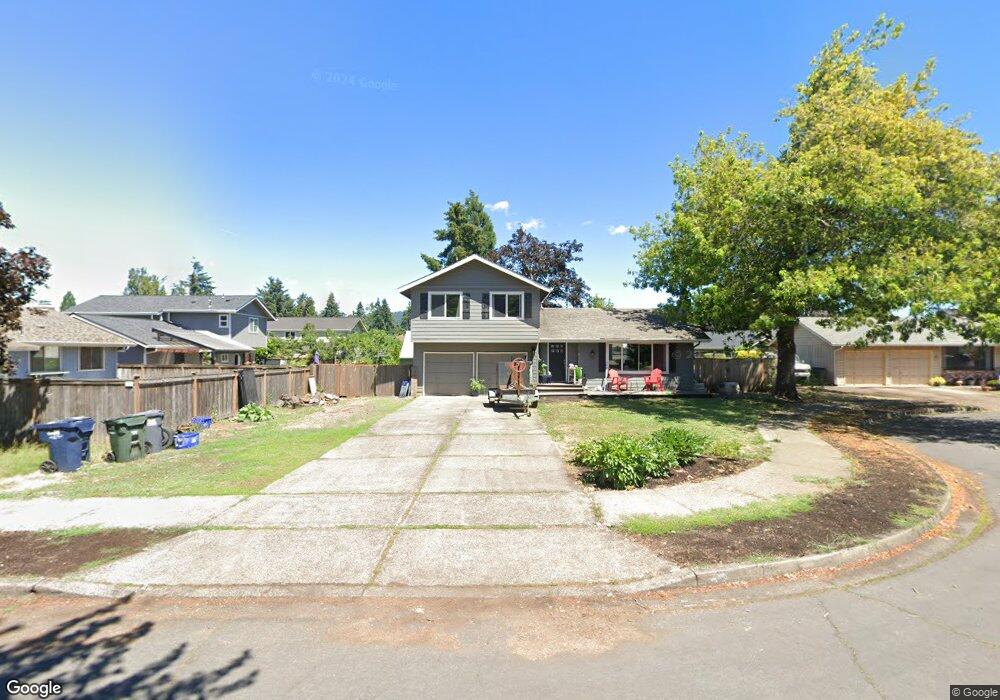
579 71st St Springfield, OR 97478
Thurston NeighborhoodEstimated Value: $395,000 - $427,000
3
Beds
3
Baths
1,533
Sq Ft
$268/Sq Ft
Est. Value
About This Home
This home is located at 579 71st St, Springfield, OR 97478 and is currently estimated at $410,922, approximately $268 per square foot. 579 71st St is a home located in Lane County with nearby schools including Thurston Elementary School, Thurston Middle School, and Thurston High School.
Ownership History
Date
Name
Owned For
Owner Type
Purchase Details
Closed on
Jul 23, 2008
Sold by
Clark Radley R
Bought by
Knights Coy Dean and Knights Nicole Marie
Current Estimated Value
Home Financials for this Owner
Home Financials are based on the most recent Mortgage that was taken out on this home.
Original Mortgage
$191,900
Outstanding Balance
$125,449
Interest Rate
6.42%
Mortgage Type
Purchase Money Mortgage
Estimated Equity
$285,473
Purchase Details
Closed on
Jun 5, 2006
Sold by
Clark Radley R and Clark Radley
Bought by
Clark Radley R and Clark Darla
Home Financials for this Owner
Home Financials are based on the most recent Mortgage that was taken out on this home.
Original Mortgage
$172,800
Interest Rate
6.56%
Mortgage Type
Fannie Mae Freddie Mac
Purchase Details
Closed on
Nov 10, 2004
Sold by
English Rose M
Bought by
Clark Radley
Home Financials for this Owner
Home Financials are based on the most recent Mortgage that was taken out on this home.
Original Mortgage
$136,000
Interest Rate
6.4%
Mortgage Type
Purchase Money Mortgage
Create a Home Valuation Report for This Property
The Home Valuation Report is an in-depth analysis detailing your home's value as well as a comparison with similar homes in the area
Home Values in the Area
Average Home Value in this Area
Purchase History
| Date | Buyer | Sale Price | Title Company |
|---|---|---|---|
| Knights Coy Dean | $202,000 | Fidelity National Title Insu | |
| Clark Radley R | -- | Fidelity National Title Insu | |
| Clark Radley | $170,000 | Western Pioneer Title Co |
Source: Public Records
Mortgage History
| Date | Status | Borrower | Loan Amount |
|---|---|---|---|
| Open | Knights Coy Dean | $191,900 | |
| Previous Owner | Clark Radley R | $172,800 | |
| Previous Owner | Clark Radley | $136,000 | |
| Closed | Clark Radley | $34,000 |
Source: Public Records
Tax History
| Year | Tax Paid | Tax Assessment Tax Assessment Total Assessment is a certain percentage of the fair market value that is determined by local assessors to be the total taxable value of land and additions on the property. | Land | Improvement |
|---|---|---|---|---|
| 2025 | $3,873 | $211,199 | -- | -- |
| 2024 | $3,810 | $205,048 | -- | -- |
| 2023 | $3,810 | $199,076 | $0 | $0 |
| 2022 | $3,529 | $193,278 | $0 | $0 |
| 2021 | $3,466 | $187,649 | $0 | $0 |
| 2020 | $3,364 | $182,184 | $0 | $0 |
| 2019 | $3,263 | $176,878 | $0 | $0 |
| 2018 | $3,076 | $166,725 | $0 | $0 |
| 2017 | $2,958 | $166,725 | $0 | $0 |
| 2016 | $2,896 | $161,869 | $0 | $0 |
| 2015 | $2,813 | $157,154 | $0 | $0 |
| 2014 | $2,771 | $152,577 | $0 | $0 |
Source: Public Records
Map
Nearby Homes
- 468 72nd St
- 353 71st St
- 0 Omlid Dr Unit 1 706471345
- 0 Omlid Dr Unit 11
- 0 Omlid Dr Unit 27 796722689
- 0 Omlid Dr Unit 26 256458253
- 0 Omlid Dr Unit 10
- 0 Omlid Dr Unit 3 154724851
- 0 Omlid Dr Unit 2 312357104
- 6875 B St
- 7080 Thurston Rd Unit 2
- 7438 A St
- 6898 Thurston Rd
- 246 S 70th St
- 250 68th St
- 6885 Simeon Dr
- 6964 Bluebelle Way
- 555 66th St
- 616 S 71st St
- 7027 S E St
Your Personal Tour Guide
Ask me questions while you tour the home.