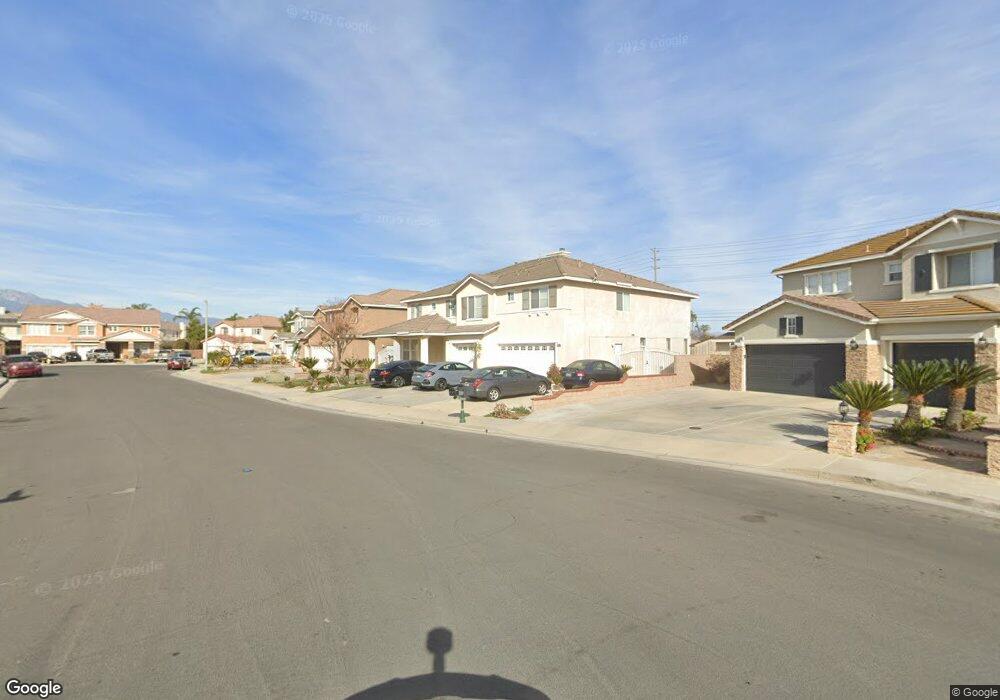
5790 Cairo Ct Corona, CA 92880
Estimated Value: $984,938 - $1,121,000
5
Beds
4
Baths
3,757
Sq Ft
$286/Sq Ft
Est. Value
About This Home
This home is located at 5790 Cairo Ct, Corona, CA 92880 and is currently estimated at $1,073,985, approximately $285 per square foot. 5790 Cairo Ct is a home located in Riverside County with nearby schools including Harada Elementary School, River Heights Intermediate School, and Eleanor Roosevelt High School.
Ownership History
Date
Name
Owned For
Owner Type
Purchase Details
Closed on
May 9, 2025
Sold by
Siregar Parlin and Siregar Ruda
Bought by
Siregar Sormin Family Trust and Siregar
Current Estimated Value
Purchase Details
Closed on
Nov 25, 2020
Sold by
Sormin Parlin Siregar and Sormin Ruda Siregar
Bought by
Sormin Parlin Siregar and Sormin Ruda Siregar
Home Financials for this Owner
Home Financials are based on the most recent Mortgage that was taken out on this home.
Original Mortgage
$256,000
Interest Rate
2.71%
Mortgage Type
New Conventional
Purchase Details
Closed on
Feb 18, 2003
Sold by
Regent Norco Llc
Bought by
Siregar Parlin and Siregar Ruda
Home Financials for this Owner
Home Financials are based on the most recent Mortgage that was taken out on this home.
Original Mortgage
$237,488
Interest Rate
5.6%
Create a Home Valuation Report for This Property
The Home Valuation Report is an in-depth analysis detailing your home's value as well as a comparison with similar homes in the area
Home Values in the Area
Average Home Value in this Area
Purchase History
| Date | Buyer | Sale Price | Title Company |
|---|---|---|---|
| Siregar Sormin Family Trust | -- | None Listed On Document | |
| Sormin Parlin Siregar | -- | Solidifi | |
| Siregar Parlin | $318,000 | Stewart Title |
Source: Public Records
Mortgage History
| Date | Status | Borrower | Loan Amount |
|---|---|---|---|
| Previous Owner | Sormin Parlin Siregar | $256,000 | |
| Previous Owner | Siregar Parlin | $237,488 |
Source: Public Records
Tax History
| Year | Tax Paid | Tax Assessment Tax Assessment Total Assessment is a certain percentage of the fair market value that is determined by local assessors to be the total taxable value of land and additions on the property. | Land | Improvement |
|---|---|---|---|---|
| 2025 | $7,301 | $464,909 | $108,609 | $356,300 |
| 2023 | $7,301 | $446,858 | $104,393 | $342,465 |
| 2022 | $7,098 | $438,097 | $102,347 | $335,750 |
| 2021 | $6,960 | $429,508 | $100,341 | $329,167 |
| 2020 | $6,869 | $425,105 | $99,313 | $325,792 |
| 2019 | $6,737 | $416,770 | $97,366 | $319,404 |
| 2018 | $6,590 | $408,599 | $95,458 | $313,141 |
| 2017 | $6,447 | $400,588 | $93,587 | $307,001 |
| 2016 | $6,344 | $392,734 | $91,752 | $300,982 |
| 2015 | $6,184 | $382,601 | $90,374 | $292,227 |
| 2014 | $5,989 | $375,107 | $88,604 | $286,503 |
Source: Public Records
Map
Nearby Homes
- 5800 Hamner Ave Unit 178
- 5800 Hamner Ave Unit 447
- 5800 Hamner Ave Unit 416
- 5800 Hamner Ave Unit 660
- 5800 Hamner Ave Unit 159
- 5800 Hamner Ave Unit 387
- 5800 Hamner Ave Unit 72
- 5800 Hamner Ave Unit 156
- 5800 Hamner Ave Unit 197
- 5800 Hamner Ave Unit 601
- 5800 Hamner Ave Unit 236
- 5800 Hamner Ave Unit 568
- 12679 Silas Phelps Dr
- 5597 Cambria Dr
- 12782 Lomond Way
- 12786 Lomond Way
- 12777 Bolsa Dr
- 6388 Pictor
- 5737 Annandale Place
- 416 Hamner Ave
- 5782 Cairo Ct
- 5798 Cairo Ct
- 5774 Cairo Ct
- 12605 Bridgewater Dr
- 5795 Cairo Ct
- 5787 Cairo Ct
- 12611 Bridgewater Dr
- 5779 Cairo Ct
- 12617 Bridgewater Dr
- 5766 Cairo Ct
- 5796 Territory Ln
- 5771 Cairo Ct
- 5788 Territory Ln
- 5758 Cairo Ct
- 12629 Bridgewater Dr
- 5763 Cairo Ct
- 5780 Territory Ln
- 12641 Bridgewater Dr
- 5772 Territory Ln
- 12649 Longhorne Dr
Your Personal Tour Guide
Ask me questions while you tour the home.