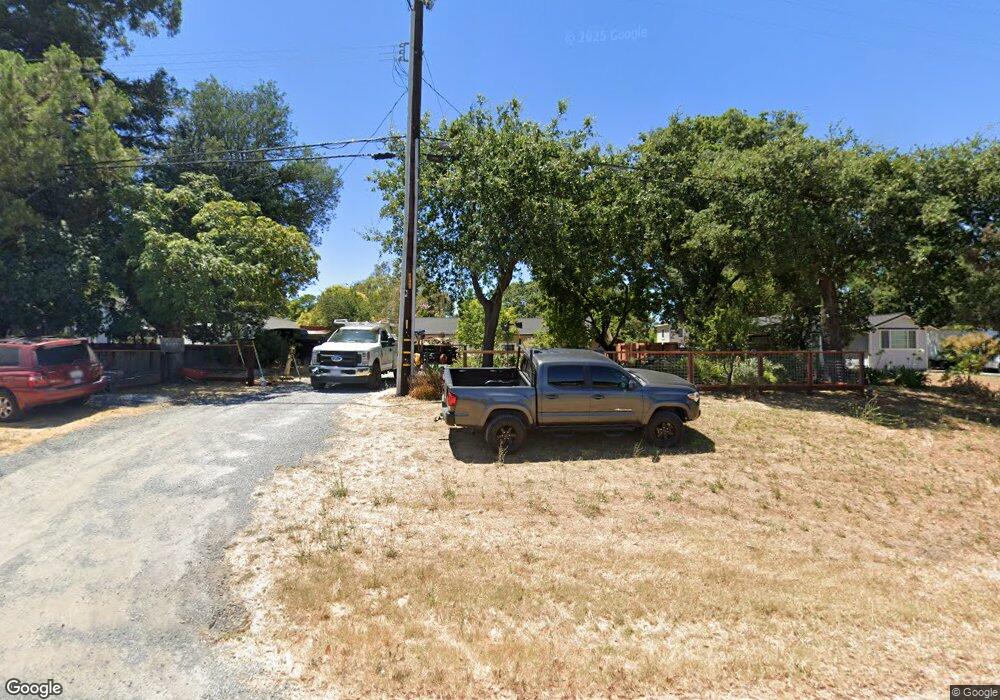
5793 Windsor Rd Windsor, CA 95492
Estimated Value: $665,000 - $1,300,000
3
Beds
1
Bath
1,305
Sq Ft
$672/Sq Ft
Est. Value
About This Home
This home is located at 5793 Windsor Rd, Windsor, CA 95492 and is currently estimated at $877,550, approximately $672 per square foot. 5793 Windsor Rd is a home located in Sonoma County with nearby schools including Mattie Washburn Elementary School, Brooks Elementary School, and Windsor Middle School.
Ownership History
Date
Name
Owned For
Owner Type
Purchase Details
Closed on
Sep 2, 2021
Sold by
Higgins Richard D and Higgins Dana A
Bought by
Higgins Richard D and Higgins Dana A
Current Estimated Value
Purchase Details
Closed on
Oct 28, 1998
Sold by
Parker William F and Parker Barbara J
Bought by
Higgins Richard D and Higgins Dana A
Home Financials for this Owner
Home Financials are based on the most recent Mortgage that was taken out on this home.
Original Mortgage
$152,000
Outstanding Balance
$33,207
Interest Rate
6.6%
Estimated Equity
$844,343
Create a Home Valuation Report for This Property
The Home Valuation Report is an in-depth analysis detailing your home's value as well as a comparison with similar homes in the area
Home Values in the Area
Average Home Value in this Area
Purchase History
| Date | Buyer | Sale Price | Title Company |
|---|---|---|---|
| Higgins Richard D | -- | None Available | |
| Higgins Richard D | $190,000 | North American Title Co |
Source: Public Records
Mortgage History
| Date | Status | Borrower | Loan Amount |
|---|---|---|---|
| Open | Higgins Richard D | $152,000 | |
| Closed | Higgins Richard D | $19,000 |
Source: Public Records
Tax History
| Year | Tax Paid | Tax Assessment Tax Assessment Total Assessment is a certain percentage of the fair market value that is determined by local assessors to be the total taxable value of land and additions on the property. | Land | Improvement |
|---|---|---|---|---|
| 2025 | $3,658 | $297,846 | $148,923 | $148,923 |
| 2024 | $3,658 | $292,006 | $146,003 | $146,003 |
| 2023 | $3,658 | $286,282 | $143,141 | $143,141 |
| 2022 | $3,526 | $280,670 | $140,335 | $140,335 |
| 2021 | $3,452 | $275,168 | $137,584 | $137,584 |
| 2020 | $3,526 | $272,348 | $136,174 | $136,174 |
| 2019 | $3,522 | $267,008 | $133,504 | $133,504 |
| 2018 | $3,472 | $261,774 | $130,887 | $130,887 |
| 2017 | $3,441 | $256,642 | $128,321 | $128,321 |
| 2016 | $3,230 | $251,610 | $125,805 | $125,805 |
| 2015 | $3,142 | $247,832 | $123,916 | $123,916 |
| 2014 | $3,095 | $242,978 | $121,489 | $121,489 |
Source: Public Records
Map
Nearby Homes
- 1439 Birdie Dr
- 1384 Birdie Dr
- 1332 Eagle Dr
- 7225 16th Hole Dr
- 1349 Golf Course Dr
- 925 Pinot Noir Way
- 8596 Starr Rd
- 7830 Foppiano Way
- 8484 Trione Cir
- 705 Shiloh Rd
- 107 Bouquet Cir
- 8148 D St
- 8145 Willow St
- 8156 D St
- 1145 Portello Ln
- 1038 Capewood Ln
- 3000 River Rd
- 8147 Willow St
- 1138 Broadleaf Ln
- 333 Cornell Stree
Your Personal Tour Guide
Ask me questions while you tour the home.