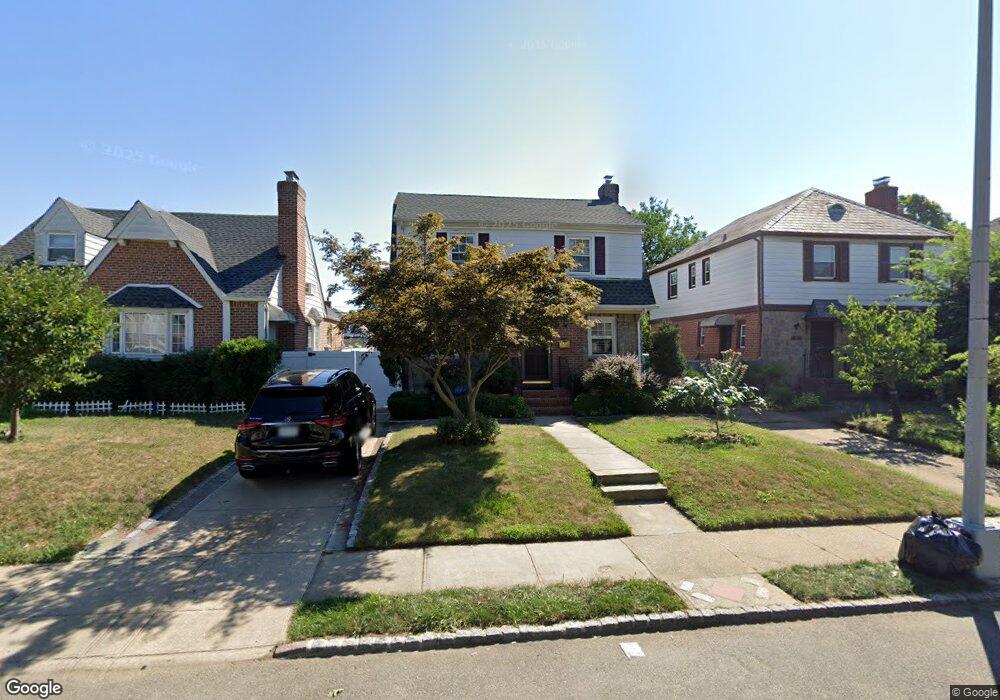
58-23 215th St Flushing, NY 11364
Bayside NeighborhoodEstimated Value: $986,000 - $1,172,000
3
Beds
2
Baths
1,296
Sq Ft
$844/Sq Ft
Est. Value
About This Home
This home is located at 58-23 215th St, Flushing, NY 11364 and is currently estimated at $1,093,375, approximately $843 per square foot. 58-23 215th St is a home located in Queens County with nearby schools including P.S. 203 - Oakland Gardens, P.S. 376, and Nathaniel Hawthorne Middle School 74.
Ownership History
Date
Name
Owned For
Owner Type
Purchase Details
Closed on
Jun 11, 2021
Sold by
Radice Joan and Radice Steven
Bought by
Home Pro Realtor Inc
Current Estimated Value
Home Financials for this Owner
Home Financials are based on the most recent Mortgage that was taken out on this home.
Original Mortgage
$574,000
Outstanding Balance
$519,685
Interest Rate
2.9%
Mortgage Type
Purchase Money Mortgage
Estimated Equity
$573,690
Purchase Details
Closed on
Apr 7, 1997
Sold by
Boone Marion E
Bought by
Radice Steven and Radice Joan
Create a Home Valuation Report for This Property
The Home Valuation Report is an in-depth analysis detailing your home's value as well as a comparison with similar homes in the area
Home Values in the Area
Average Home Value in this Area
Purchase History
| Date | Buyer | Sale Price | Title Company |
|---|---|---|---|
| Home Pro Realtor Inc | $958,000 | -- | |
| Radice Steven | $275,000 | First American Title Ins Co |
Source: Public Records
Mortgage History
| Date | Status | Borrower | Loan Amount |
|---|---|---|---|
| Open | Home Pro Realtor Inc | $574,000 |
Source: Public Records
Tax History Compared to Growth
Tax History
| Year | Tax Paid | Tax Assessment Tax Assessment Total Assessment is a certain percentage of the fair market value that is determined by local assessors to be the total taxable value of land and additions on the property. | Land | Improvement |
|---|---|---|---|---|
| 2025 | $10,219 | $50,878 | $12,372 | $38,506 |
| 2024 | $10,219 | $50,878 | $13,653 | $37,225 |
| 2023 | $9,875 | $49,166 | $12,745 | $36,421 |
| 2022 | $9,441 | $54,480 | $16,020 | $38,460 |
| 2021 | $9,114 | $58,260 | $16,020 | $42,240 |
| 2020 | $8,678 | $55,740 | $16,020 | $39,720 |
| 2019 | $8,576 | $59,880 | $16,020 | $43,860 |
| 2018 | $8,055 | $40,972 | $10,662 | $30,310 |
| 2017 | $7,734 | $39,412 | $11,159 | $28,253 |
| 2016 | $7,139 | $39,412 | $11,159 | $28,253 |
| 2015 | $4,265 | $35,332 | $13,523 | $21,809 |
| 2014 | $4,265 | $35,332 | $14,906 | $20,426 |
Source: Public Records
Map
Nearby Homes