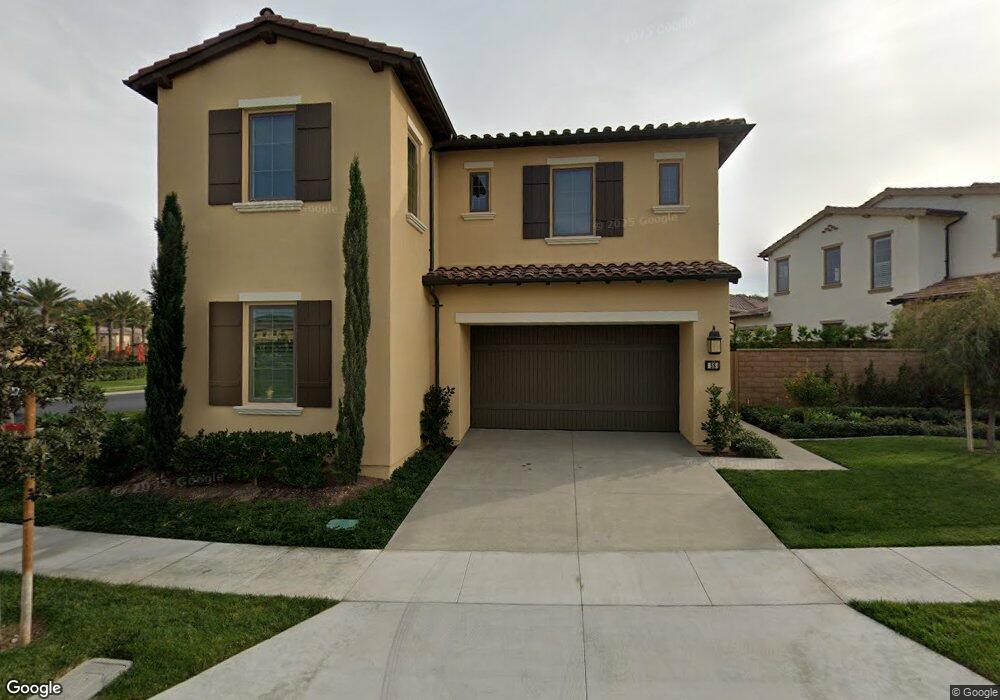
58 Bountiful Irvine, CA 92602
Orchard Hills NeighborhoodEstimated Value: $2,404,000 - $2,796,000
4
Beds
5
Baths
2,830
Sq Ft
$933/Sq Ft
Est. Value
About This Home
This home is located at 58 Bountiful, Irvine, CA 92602 and is currently estimated at $2,640,865, approximately $933 per square foot. 58 Bountiful is a home with nearby schools including Canyon View Elementary School, Sierra Vista Middle School, and Northwood High School.
Ownership History
Date
Name
Owned For
Owner Type
Purchase Details
Closed on
Jan 27, 2016
Sold by
Irvine Pacific Lp
Bought by
The Roh Revocable Living Trust
Current Estimated Value
Home Financials for this Owner
Home Financials are based on the most recent Mortgage that was taken out on this home.
Original Mortgage
$930,640
Outstanding Balance
$724,571
Interest Rate
3.25%
Mortgage Type
New Conventional
Estimated Equity
$1,916,294
Purchase Details
Closed on
Oct 12, 2015
Sold by
Irvine Community Development Company Llc
Bought by
Irvine Pacific Lp
Create a Home Valuation Report for This Property
The Home Valuation Report is an in-depth analysis detailing your home's value as well as a comparison with similar homes in the area
Home Values in the Area
Average Home Value in this Area
Purchase History
| Date | Buyer | Sale Price | Title Company |
|---|---|---|---|
| The Roh Revocable Living Trust | $1,241,000 | First American Title Company | |
| Irvine Pacific Lp | -- | First American Title Company |
Source: Public Records
Mortgage History
| Date | Status | Borrower | Loan Amount |
|---|---|---|---|
| Open | The Roh Revocable Living Trust | $930,640 |
Source: Public Records
Tax History
| Year | Tax Paid | Tax Assessment Tax Assessment Total Assessment is a certain percentage of the fair market value that is determined by local assessors to be the total taxable value of land and additions on the property. | Land | Improvement |
|---|---|---|---|---|
| 2025 | $19,475 | $1,468,917 | $843,063 | $625,854 |
| 2024 | $19,475 | $1,440,115 | $826,532 | $613,583 |
| 2023 | $19,127 | $1,411,878 | $810,326 | $601,552 |
| 2022 | $18,829 | $1,384,195 | $794,438 | $589,757 |
| 2021 | $18,540 | $1,357,054 | $778,860 | $578,194 |
| 2020 | $18,388 | $1,343,140 | $770,874 | $572,266 |
| 2019 | $18,257 | $1,316,804 | $755,758 | $561,046 |
| 2018 | $17,984 | $1,290,985 | $740,939 | $550,046 |
| 2017 | $17,715 | $1,265,672 | $726,411 | $539,261 |
| 2016 | $8,401 | $387,099 | $17,021 | $370,078 |
| 2015 | $3,616 | $16,766 | $16,766 | $0 |
Source: Public Records
Map
Nearby Homes
Your Personal Tour Guide
Ask me questions while you tour the home.