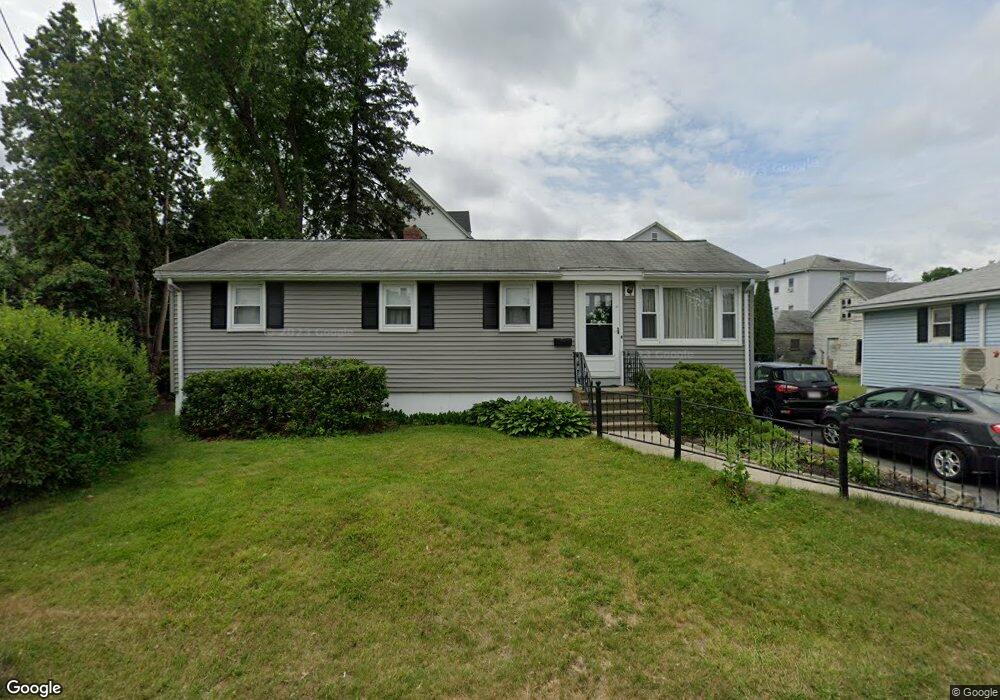
58 King Philip Rd Worcester, MA 01606
Greendale NeighborhoodEstimated Value: $321,782 - $377,000
2
Beds
1
Bath
840
Sq Ft
$422/Sq Ft
Est. Value
About This Home
This home is located at 58 King Philip Rd, Worcester, MA 01606 and is currently estimated at $354,446, approximately $421 per square foot. 58 King Philip Rd is a home located in Worcester County with nearby schools including Jacob Hiatt Magnet School, Chandler Magnet, and Thorndyke Road School.
Ownership History
Date
Name
Owned For
Owner Type
Purchase Details
Closed on
Sep 21, 2001
Sold by
Henning Joy C
Bought by
Shea Wayne G and Shea Ingrid E
Current Estimated Value
Home Financials for this Owner
Home Financials are based on the most recent Mortgage that was taken out on this home.
Original Mortgage
$129,200
Outstanding Balance
$50,344
Interest Rate
6.98%
Mortgage Type
Purchase Money Mortgage
Estimated Equity
$304,102
Purchase Details
Closed on
Aug 28, 1997
Sold by
White Gary J
Bought by
Hennig Joy C
Home Financials for this Owner
Home Financials are based on the most recent Mortgage that was taken out on this home.
Original Mortgage
$69,200
Interest Rate
7.41%
Mortgage Type
Purchase Money Mortgage
Purchase Details
Closed on
Aug 8, 1996
Sold by
Department Of Housing & Urban Dev
Bought by
White Gary J
Purchase Details
Closed on
May 10, 1995
Sold by
Million Diane
Bought by
Platte Valley Fund Lp
Purchase Details
Closed on
Jan 21, 1993
Sold by
King Philip Rt
Bought by
Baltic Realty Corp
Purchase Details
Closed on
Oct 2, 1989
Sold by
Savoie Julien
Bought by
Million Diane
Create a Home Valuation Report for This Property
The Home Valuation Report is an in-depth analysis detailing your home's value as well as a comparison with similar homes in the area
Home Values in the Area
Average Home Value in this Area
Purchase History
We collect this data history from publicly available records. To have your information removed, we recommend requesting removal directly through your county’s website.
| Date | Buyer | Sale Price | Title Company |
|---|---|---|---|
| Shea Wayne G | $136,000 | -- | |
| Hennig Joy C | $86,500 | -- | |
| White Gary J | $55,000 | -- | |
| Platte Valley Fund Lp | $113,652 | -- | |
| Baltic Realty Corp | $150,000 | -- | |
| Million Diane | $95,500 | -- |
Source: Public Records
Mortgage History
We collect this data history from publicly available records. To have your information removed, we recommend requesting removal directly through your county’s website.
| Date | Status | Borrower | Loan Amount |
|---|---|---|---|
| Open | Million Diane | $129,200 | |
| Previous Owner | Million Diane | $63,800 | |
| Previous Owner | Million Diane | $69,200 |
Source: Public Records
Tax History
| Year | Tax Paid | Tax Assessment Tax Assessment Total Assessment is a certain percentage of the fair market value that is determined by local assessors to be the total taxable value of land and additions on the property. | Land | Improvement |
|---|---|---|---|---|
| 2025 | $3,436 | $260,500 | $79,100 | $181,400 |
| 2024 | $3,358 | $244,200 | $79,100 | $165,100 |
| 2023 | $3,249 | $226,600 | $68,800 | $157,800 |
| 2022 | $2,878 | $189,200 | $55,000 | $134,200 |
| 2021 | $2,790 | $171,400 | $44,000 | $127,400 |
| 2020 | $2,672 | $157,200 | $44,000 | $113,200 |
| 2019 | $2,507 | $139,300 | $39,600 | $99,700 |
| 2018 | $2,426 | $128,300 | $39,600 | $88,700 |
| 2017 | $2,418 | $125,800 | $39,600 | $86,200 |
| 2016 | $2,389 | $115,900 | $30,300 | $85,600 |
| 2015 | $2,326 | $115,900 | $30,300 | $85,600 |
| 2014 | $2,265 | $115,900 | $30,300 | $85,600 |
Source: Public Records
Map
Nearby Homes
- 53 Barber Ave
- 85 Kalmar St
- 78 Leeds St
- 26 Fales St
- 336 Burncoat St
- 35 Boardman St
- 100 Assumption Ave
- 223 Beverly Rd
- 25 Kenwood Ave
- 36 Rowena St
- 39 Boyd St
- 42 Hastings Ave
- 46 Hastings Ave
- 31 Barnard Rd
- 1 Basswood Blvd Unit 1
- 38 Gifford Dr
- 86 Saint Nicholas Ave
- 15 Birmingham Rd
- 125 Indian Hill Rd
- 32 Indian Lake Pkwy
- 48 King Philip Rd
- 46 King Philip Rd
- 46 King Philip Rd Unit 2
- 54 King Philip Rd
- 45 Andover St
- 42 King Philip Rd
- 51 Andover St
- 51 King Philip Rd
- 41 Andover St
- 55 Andover St
- 55 Andover St Unit 2
- 59 King Philip Rd
- 59 King Philip Rd Unit 3
- 59 King Philip Rd Unit 2
- 37 Andover St
- 38 King Philip Rd
- 43 King Philip Rd
- 57 Andover St
- 646668 King Philip Rd
- 61 King Philip Rd
Your Personal Tour Guide
Ask me questions while you tour the home.