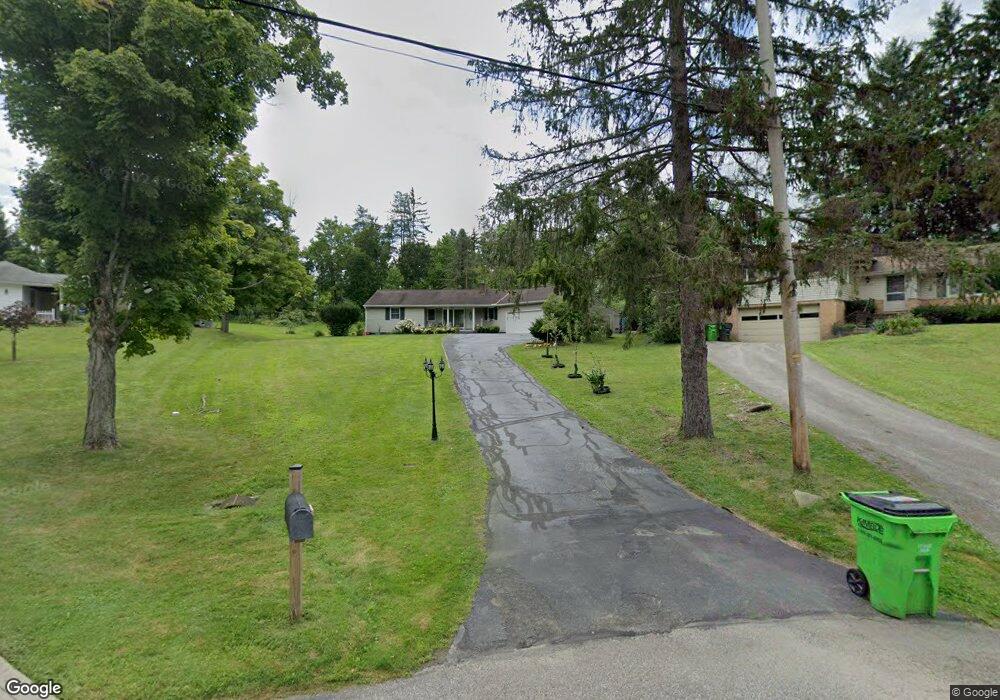
58 Lyndale Dr Chagrin Falls, OH 44022
Estimated Value: $439,000 - $519,000
3
Beds
2
Baths
1,911
Sq Ft
$247/Sq Ft
Est. Value
About This Home
This home is located at 58 Lyndale Dr, Chagrin Falls, OH 44022 and is currently estimated at $472,041, approximately $247 per square foot. 58 Lyndale Dr is a home located in Cuyahoga County with nearby schools including Gurney Elementary School, Chagrin Falls Intermediate Elementary School, and Chagrin Falls Middle School.
Ownership History
Date
Name
Owned For
Owner Type
Purchase Details
Closed on
Aug 24, 2004
Sold by
Pound Ann Cathleen
Bought by
Yampolskiy Leonid
Current Estimated Value
Home Financials for this Owner
Home Financials are based on the most recent Mortgage that was taken out on this home.
Original Mortgage
$130,000
Outstanding Balance
$64,807
Interest Rate
6.08%
Mortgage Type
Purchase Money Mortgage
Estimated Equity
$407,234
Purchase Details
Closed on
Jan 18, 1980
Sold by
Pound Homer J
Bought by
Homer J Pound
Purchase Details
Closed on
Jan 1, 1975
Bought by
Pound Homer J
Create a Home Valuation Report for This Property
The Home Valuation Report is an in-depth analysis detailing your home's value as well as a comparison with similar homes in the area
Home Values in the Area
Average Home Value in this Area
Purchase History
| Date | Buyer | Sale Price | Title Company |
|---|---|---|---|
| Yampolskiy Leonid | $165,000 | Revere | |
| Homer J Pound | -- | -- | |
| Pound Homer J | -- | -- |
Source: Public Records
Mortgage History
| Date | Status | Borrower | Loan Amount |
|---|---|---|---|
| Open | Yampolskiy Leonid | $130,000 |
Source: Public Records
Tax History Compared to Growth
Tax History
| Year | Tax Paid | Tax Assessment Tax Assessment Total Assessment is a certain percentage of the fair market value that is determined by local assessors to be the total taxable value of land and additions on the property. | Land | Improvement |
|---|---|---|---|---|
| 2024 | $6,451 | $114,415 | $15,540 | $98,875 |
| 2023 | $6,201 | $96,290 | $31,080 | $65,210 |
| 2022 | $6,590 | $96,285 | $31,080 | $65,205 |
| 2021 | $6,562 | $96,290 | $31,080 | $65,210 |
| 2020 | $6,254 | $77,000 | $24,850 | $52,150 |
| 2019 | $6,159 | $220,000 | $71,000 | $149,000 |
| 2018 | $5,689 | $77,000 | $24,850 | $52,150 |
| 2017 | $5,841 | $69,480 | $14,770 | $54,710 |
| 2016 | $5,244 | $69,480 | $14,770 | $54,710 |
| 2015 | $5,337 | $69,480 | $14,770 | $54,710 |
| 2014 | $5,337 | $69,480 | $14,770 | $54,710 |
Source: Public Records
Map
Nearby Homes
- 115 E Summit St
- 310 Falls Walk Way
- 58 W Orange St
- 20 Solether Ln
- 106 W Washington St
- 110 Emilia Ct
- 0 Bell St
- 81 Hall St
- 156 S Franklin St
- 207 S Main St
- 150 Greentree Rd
- 213 S Main St
- 9 E Carriage Dr
- 219 S Main St
- 20 Stonecreek Dr
- 80 South St
- 225 S Main St
- 235 Solon Rd Unit D
- 5 Skyline Dr
- 389 Bentleyville Rd