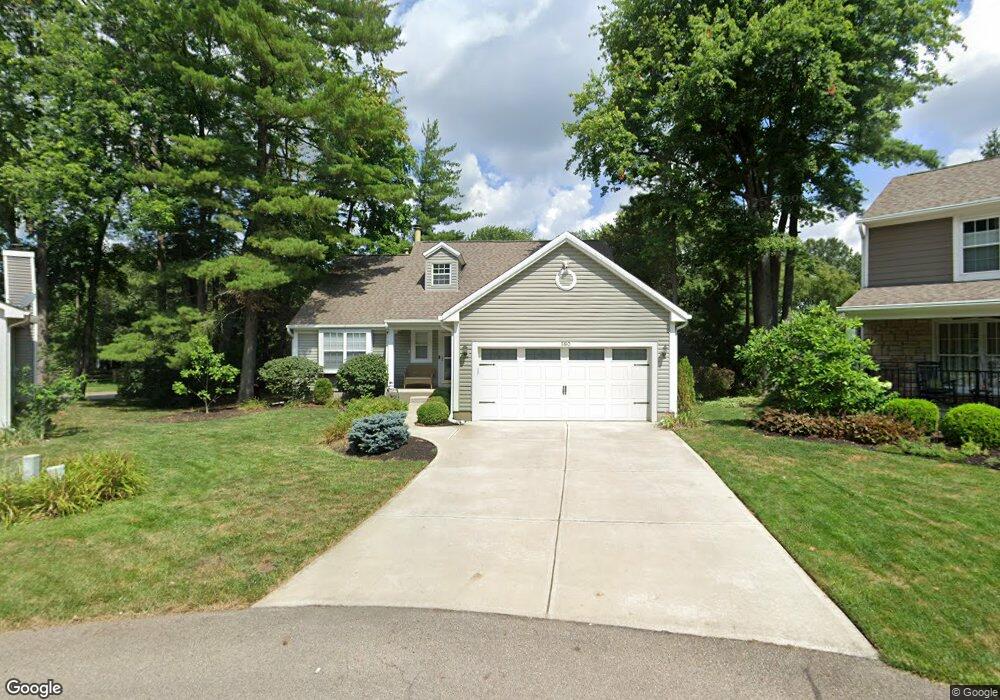
580 Eagles Nest Maineville, OH 45039
Estimated Value: $364,000 - $382,000
4
Beds
3
Baths
1,818
Sq Ft
$204/Sq Ft
Est. Value
About This Home
This home is located at 580 Eagles Nest, Maineville, OH 45039 and is currently estimated at $371,657, approximately $204 per square foot. 580 Eagles Nest is a home located in Warren County with nearby schools including Little Miami Early Childhood Center, Little Miami Intermediate Middle School, and Little Miami Middle School.
Ownership History
Date
Name
Owned For
Owner Type
Purchase Details
Closed on
Sep 14, 2012
Sold by
Rodenhauser Shasta E
Bought by
Rodenhauser Shasta E and Rodenhauser Eric C
Current Estimated Value
Home Financials for this Owner
Home Financials are based on the most recent Mortgage that was taken out on this home.
Original Mortgage
$136,000
Outstanding Balance
$17,108
Interest Rate
3.58%
Mortgage Type
New Conventional
Estimated Equity
$354,549
Purchase Details
Closed on
Oct 11, 2002
Sold by
Emc Mtg Corp
Bought by
Rodenhauser Shasta E
Purchase Details
Closed on
Sep 4, 1996
Sold by
Janson David C
Bought by
Ehrhart Leonard M
Purchase Details
Closed on
Feb 4, 1988
Sold by
Williamsburg Properties &
Bought by
Janson Janson and Janson David C
Purchase Details
Closed on
Nov 6, 1987
Sold by
Cincinnati Land Developme
Bought by
Williamsburg Properties
Purchase Details
Closed on
Oct 21, 1986
Sold by
Cincinnati Land Developme
Bought by
Cincinnati Land Developme
Create a Home Valuation Report for This Property
The Home Valuation Report is an in-depth analysis detailing your home's value as well as a comparison with similar homes in the area
Home Values in the Area
Average Home Value in this Area
Purchase History
| Date | Buyer | Sale Price | Title Company |
|---|---|---|---|
| Rodenhauser Shasta E | -- | Imperial Title | |
| Rodenhauser Shasta E | $147,000 | -- | |
| Ehrhart Leonard M | $153,000 | -- | |
| Janson Janson | $121,400 | -- | |
| Williamsburg Properties | -- | -- | |
| Cincinnati Land Developme | -- | -- |
Source: Public Records
Mortgage History
| Date | Status | Borrower | Loan Amount |
|---|---|---|---|
| Open | Rodenhauser Shasta E | $136,000 | |
| Closed | Rodenhauser Shasta E | $0 |
Source: Public Records
Tax History
| Year | Tax Paid | Tax Assessment Tax Assessment Total Assessment is a certain percentage of the fair market value that is determined by local assessors to be the total taxable value of land and additions on the property. | Land | Improvement |
|---|---|---|---|---|
| 2025 | $4,776 | $107,180 | $34,650 | $72,530 |
| 2024 | $4,776 | $107,180 | $34,650 | $72,530 |
| 2023 | $4,194 | $83,720 | $19,372 | $64,347 |
| 2022 | $4,137 | $83,720 | $19,373 | $64,348 |
| 2021 | $3,944 | $83,720 | $19,373 | $64,348 |
| 2020 | $3,756 | $68,065 | $15,750 | $52,315 |
| 2019 | $3,818 | $68,065 | $15,750 | $52,315 |
| 2018 | $3,708 | $68,065 | $15,750 | $52,315 |
| 2017 | $3,140 | $57,190 | $11,029 | $46,162 |
| 2016 | $3,206 | $57,190 | $11,029 | $46,162 |
| 2015 | $3,199 | $57,190 | $11,029 | $46,162 |
| 2014 | $3,486 | $55,520 | $10,710 | $44,820 |
| 2013 | $3,428 | $63,530 | $12,250 | $51,280 |
Source: Public Records
Map
Nearby Homes
- 758 Stoneharbor Ln
- 6748 Sandharbor Ct
- 630 Weeping Willow Ln
- 6872 Sandharbor Ct
- 6804 Mossy Rock Ct
- 1068 Beacon Way Ct
- 880 Sunrise Ridge Ct
- 6512 Arbor Ct
- 6824 Ohio 48
- 6535 Arbor Ct
- 6772 Prairie View Dr
- 6973 Cottonwood Ct
- 1103 Grandin Pond Dr
- 6643 Cloudscape Way Unit 8305
- 1430 Tecumseh Dr
- Lot French Ct
- 1 Lot French Ct
- 1790 Amberwood Way
- 1320 Shadowood Trail Unit 21203
- 1443 Windwillow Trace Unit 27203
- 612 Eagles Nest
- 576 Eagles Nest
- 6807 Lands End Ct
- 579 Eagles Nest
- 6882 Pelicans Run Ct
- 6878 Pelicans Run Ct
- 585 Eagles Nest
- 591 Eagles Nest
- 6814 Lands End Ct
- 6801 Lands End Ct
- 6890 Pelicans Run Ct
- 611 Eagles Nest
- 6870 Pelicans Run Ct
- 788 Lakeshore Dr
- 790 Lakeshore Dr
- 6808 Lands End Ct
- 792 Lakeshore Dr
- 6900 Pelicans Run Ct
- 6795 Lands End Ct
- 794 Lakeshore Dr
Your Personal Tour Guide
Ask me questions while you tour the home.