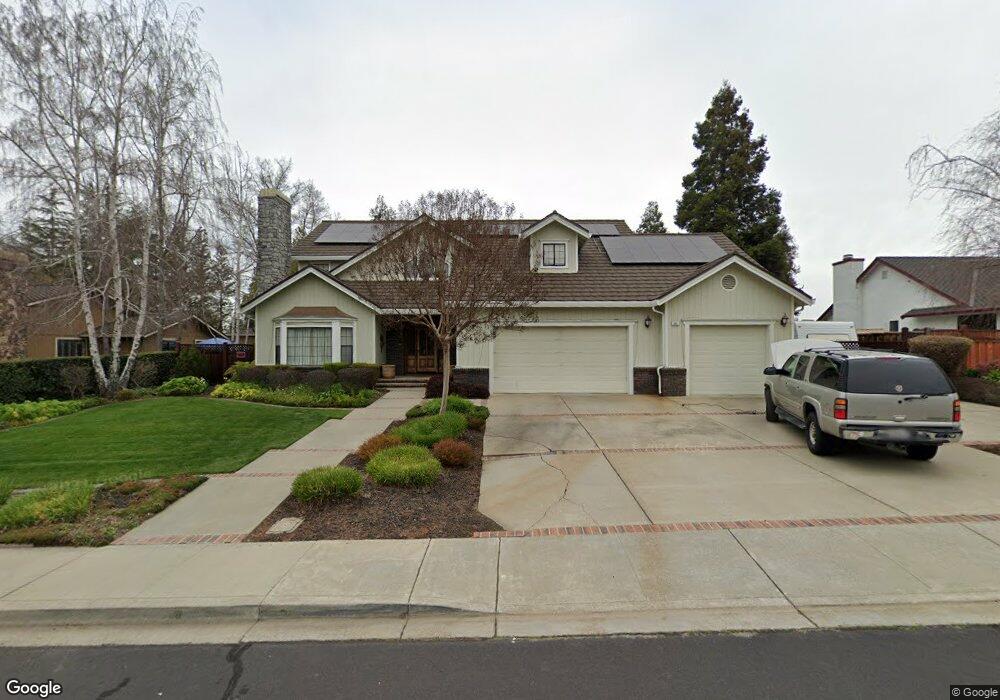
580 Lagrange Ln Livermore, CA 94550
Estimated Value: $2,111,000 - $2,468,000
5
Beds
4
Baths
3,592
Sq Ft
$655/Sq Ft
Est. Value
About This Home
This home is located at 580 Lagrange Ln, Livermore, CA 94550 and is currently estimated at $2,354,107, approximately $655 per square foot. 580 Lagrange Ln is a home located in Alameda County with nearby schools including Emma C. Smith Elementary School, William Mendenhall Middle School, and Granada High School.
Ownership History
Date
Name
Owned For
Owner Type
Purchase Details
Closed on
Sep 9, 1999
Sold by
Dewey Michael A and Dewey Kathryn
Bought by
Bond Steven W and Bond Tiziana C
Current Estimated Value
Home Financials for this Owner
Home Financials are based on the most recent Mortgage that was taken out on this home.
Original Mortgage
$360,000
Outstanding Balance
$100,999
Interest Rate
7.12%
Estimated Equity
$2,253,108
Purchase Details
Closed on
Aug 27, 1997
Sold by
Luckett Clarence L and Luckett Gwen N
Bought by
Dewey Michael A and Dewey Kathryn
Home Financials for this Owner
Home Financials are based on the most recent Mortgage that was taken out on this home.
Original Mortgage
$359,000
Interest Rate
7.43%
Create a Home Valuation Report for This Property
The Home Valuation Report is an in-depth analysis detailing your home's value as well as a comparison with similar homes in the area
Purchase History
| Date | Buyer | Sale Price | Title Company |
|---|---|---|---|
| Bond Steven W | $719,000 | First California Title Compa | |
| Dewey Michael A | $589,000 | North American Title Co |
Source: Public Records
Mortgage History
| Date | Status | Borrower | Loan Amount |
|---|---|---|---|
| Open | Bond Steven W | $360,000 | |
| Previous Owner | Dewey Michael A | $359,000 |
Source: Public Records
Tax History
| Year | Tax Paid | Tax Assessment Tax Assessment Total Assessment is a certain percentage of the fair market value that is determined by local assessors to be the total taxable value of land and additions on the property. | Land | Improvement |
|---|---|---|---|---|
| 2025 | $13,533 | $1,113,355 | $331,507 | $788,848 |
| 2024 | $13,533 | $1,091,391 | $325,008 | $773,383 |
| 2023 | $13,349 | $1,076,857 | $318,636 | $758,221 |
| 2022 | $13,173 | $1,048,745 | $312,389 | $743,356 |
| 2021 | $12,918 | $1,028,049 | $306,265 | $728,784 |
| 2020 | $12,557 | $1,024,443 | $303,127 | $721,316 |
| 2019 | $12,623 | $1,004,359 | $297,184 | $707,175 |
| 2018 | $12,372 | $984,670 | $291,358 | $693,312 |
| 2017 | $12,068 | $965,367 | $285,647 | $679,720 |
| 2016 | $11,646 | $946,443 | $280,047 | $666,396 |
| 2015 | $10,917 | $932,228 | $275,841 | $656,387 |
| 2014 | $10,731 | $913,967 | $270,438 | $643,529 |
Source: Public Records
Map
Nearby Homes
- 886 Old Oak Rd
- 628 Lido Dr
- 1556 Wagoner Dr
- 2119 Farmington Place
- 1059 Catalina Dr
- 2059 Westbrook Ln
- 101 Acorn Way
- 2367 Wedgewood Way
- 1733 Tourmaline Ct
- 727 Del Mar Ave
- 221 E Vineyard Ave
- 1144 El Dorado Dr
- 960 Elaine Ave
- 563 Cinnabar Dr
- 574 Cinnabar Dr
- 1030 Via Madrid
- 1009 Lisbon Ave
- 975 Murrieta Blvd
- 1087 Murrieta Blvd Unit 243
- 1087 Murrieta Blvd Unit 245
- 574 Lagrange Ln
- 2037 Pulsar Ave
- 568 Lagrange Ln
- 579 Regulus Rd
- 585 Regulus Rd
- 581 Lagrange Ln
- 573 Regulus Rd
- 2015 Pulsar Ave
- 2199 Lagrange Ct
- 560 Lagrange Ln
- 567 Regulus Rd
- 2079 Pulsar Ave
- 2187 Lagrange Ct
- 2058 Pulsar Ave
- 551 Regulus Rd
- 552 Lagrange Ln
- 2076 Pulsar Ave
- 582 Regulus Rd
- 2093 Pulsar Ave
- 590 Regulus Rd
Your Personal Tour Guide
Ask me questions while you tour the home.