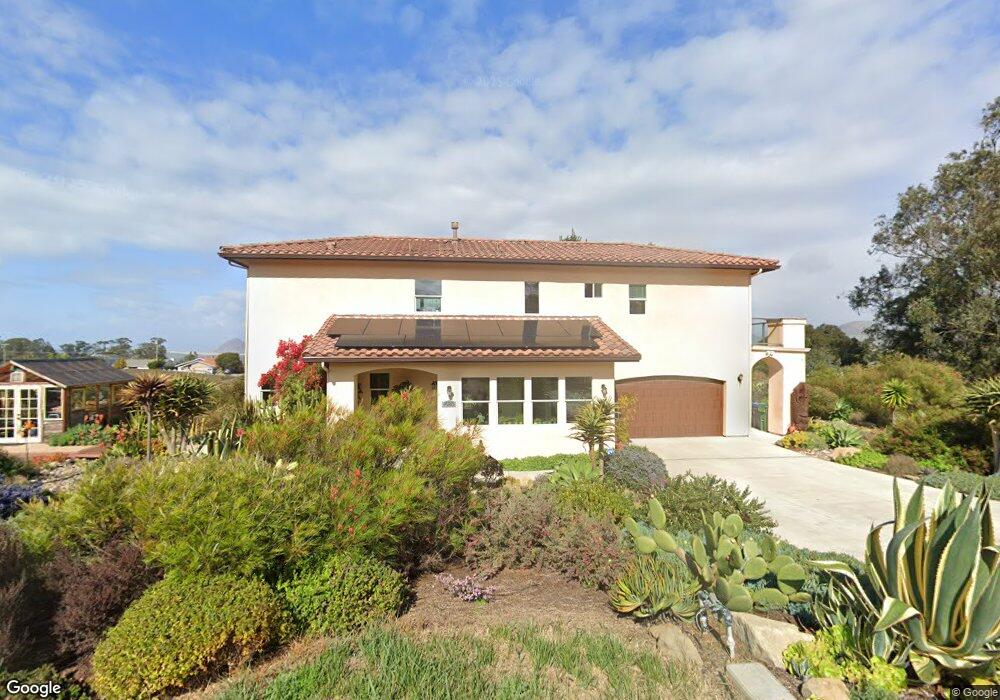
580 Rosina Dr Los Osos, CA 93402
Estimated Value: $800,000 - $1,361,000
2
Beds
2
Baths
1,000
Sq Ft
$1,002/Sq Ft
Est. Value
About This Home
This home is located at 580 Rosina Dr, Los Osos, CA 93402 and is currently estimated at $1,002,473, approximately $1,002 per square foot. 580 Rosina Dr is a home located in San Luis Obispo County with nearby schools including Monarch Grove Elementary School, Los Osos Middle School, and Morro Bay High School.
Ownership History
Date
Name
Owned For
Owner Type
Purchase Details
Closed on
Jan 22, 2019
Sold by
Corson Galen and Corson Katherine
Bought by
Corson Galen August and Corson Katherine Anne
Current Estimated Value
Purchase Details
Closed on
Apr 20, 2006
Sold by
Gorkosky Susan M
Bought by
Corson Galen and Corson Katherine
Home Financials for this Owner
Home Financials are based on the most recent Mortgage that was taken out on this home.
Original Mortgage
$384,000
Outstanding Balance
$219,779
Interest Rate
6.29%
Mortgage Type
Fannie Mae Freddie Mac
Estimated Equity
$782,694
Purchase Details
Closed on
Nov 28, 2005
Sold by
Hirschfeld Nancy
Bought by
Gorkosky Susan M
Home Financials for this Owner
Home Financials are based on the most recent Mortgage that was taken out on this home.
Original Mortgage
$345,000
Interest Rate
6.31%
Mortgage Type
Purchase Money Mortgage
Create a Home Valuation Report for This Property
The Home Valuation Report is an in-depth analysis detailing your home's value as well as a comparison with similar homes in the area
Home Values in the Area
Average Home Value in this Area
Purchase History
| Date | Buyer | Sale Price | Title Company |
|---|---|---|---|
| Corson Galen August | -- | None Available | |
| Corson Galen | $480,000 | Chicago Title Co | |
| Gorkosky Susan M | $425,000 | First American Title Co |
Source: Public Records
Mortgage History
| Date | Status | Borrower | Loan Amount |
|---|---|---|---|
| Open | Corson Galen | $384,000 | |
| Previous Owner | Gorkosky Susan M | $345,000 |
Source: Public Records
Tax History Compared to Growth
Tax History
| Year | Tax Paid | Tax Assessment Tax Assessment Total Assessment is a certain percentage of the fair market value that is determined by local assessors to be the total taxable value of land and additions on the property. | Land | Improvement |
|---|---|---|---|---|
| 2025 | $9,143 | $839,378 | $409,966 | $429,412 |
| 2024 | $8,975 | $822,921 | $401,928 | $420,993 |
| 2023 | $8,975 | $806,787 | $394,048 | $412,739 |
| 2022 | $8,414 | $790,969 | $386,322 | $404,647 |
| 2021 | $8,276 | $775,461 | $378,748 | $396,713 |
| 2020 | $8,190 | $767,511 | $374,865 | $392,646 |
| 2019 | $8,177 | $752,463 | $367,515 | $384,948 |
| 2018 | $8,016 | $737,709 | $360,309 | $377,400 |
| 2017 | $7,858 | $723,245 | $353,245 | $370,000 |
| 2016 | $5,301 | $485,000 | $265,000 | $220,000 |
| 2015 | $4,644 | $424,000 | $265,000 | $159,000 |
| 2014 | $2,748 | $264,000 | $165,000 | $99,000 |
Source: Public Records
Map
Nearby Homes