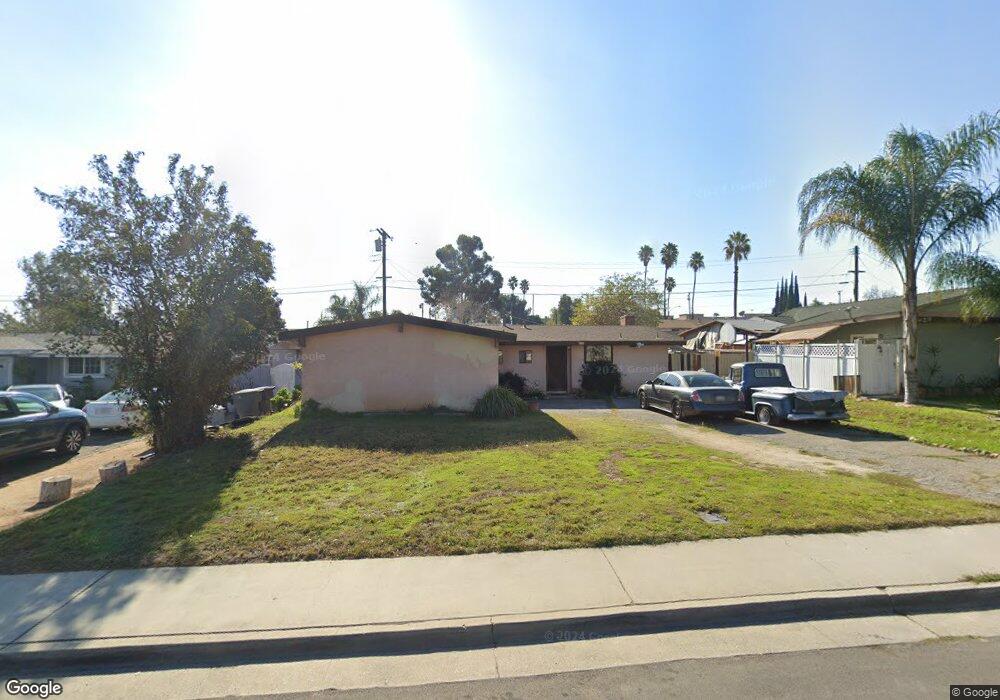
5800 Walter St Riverside, CA 92504
Estimated Value: $515,000 - $573,000
3
Beds
2
Baths
1,040
Sq Ft
$520/Sq Ft
Est. Value
About This Home
This home is located at 5800 Walter St, Riverside, CA 92504 and is currently estimated at $541,303, approximately $520 per square foot. 5800 Walter St is a home located in Riverside County with nearby schools including Adams Elementary School, Sierra Middle School, and Ramona High School.
Ownership History
Date
Name
Owned For
Owner Type
Purchase Details
Closed on
Jan 6, 2020
Sold by
Berkshire John P and Berkshire Sandy
Bought by
Berkshire John P
Current Estimated Value
Home Financials for this Owner
Home Financials are based on the most recent Mortgage that was taken out on this home.
Original Mortgage
$153,765
Outstanding Balance
$105,153
Interest Rate
3.6%
Mortgage Type
New Conventional
Estimated Equity
$436,150
Purchase Details
Closed on
Sep 17, 2004
Sold by
Berkshire Sandy
Bought by
Berkshire John P and Paul Berkshire J
Home Financials for this Owner
Home Financials are based on the most recent Mortgage that was taken out on this home.
Original Mortgage
$95,000
Interest Rate
5.8%
Mortgage Type
New Conventional
Purchase Details
Closed on
Jul 14, 2003
Sold by
Duong Judy and Duong Ky
Bought by
Berkshire J Paul
Purchase Details
Closed on
May 23, 1994
Sold by
Berkshire John P
Bought by
Duong Ky and Duong Judy
Create a Home Valuation Report for This Property
The Home Valuation Report is an in-depth analysis detailing your home's value as well as a comparison with similar homes in the area
Home Values in the Area
Average Home Value in this Area
Purchase History
| Date | Buyer | Sale Price | Title Company |
|---|---|---|---|
| Berkshire John P | -- | Amrock Inc | |
| Berkshire John P | -- | Ticor Title Company | |
| Berkshire J Paul | -- | Ticor Title San Bernardino | |
| Duong Ky | -- | -- |
Source: Public Records
Mortgage History
| Date | Status | Borrower | Loan Amount |
|---|---|---|---|
| Open | Berkshire John P | $153,765 | |
| Closed | Berkshire John P | $95,000 |
Source: Public Records
Tax History Compared to Growth
Tax History
| Year | Tax Paid | Tax Assessment Tax Assessment Total Assessment is a certain percentage of the fair market value that is determined by local assessors to be the total taxable value of land and additions on the property. | Land | Improvement |
|---|---|---|---|---|
| 2025 | $4,179 | $383,296 | $69,682 | $313,614 |
| 2023 | $4,179 | $368,414 | $66,977 | $301,437 |
| 2022 | $4,084 | $361,191 | $65,664 | $295,527 |
| 2021 | $4,034 | $354,110 | $64,377 | $289,733 |
| 2020 | $3,846 | $336,356 | $61,058 | $275,298 |
| 2019 | $3,738 | $326,560 | $59,280 | $267,280 |
| 2018 | $3,597 | $314,000 | $57,000 | $257,000 |
| 2017 | $3,244 | $282,000 | $51,000 | $231,000 |
| 2016 | $2,850 | $259,000 | $47,000 | $212,000 |
| 2015 | $2,776 | $252,000 | $46,000 | $206,000 |
| 2014 | $2,090 | $186,000 | $34,000 | $152,000 |
Source: Public Records
Map
Nearby Homes
- 5801 Walter St
- 5952 Maybelle St
- 6712 La Jolla Dr
- 6746 La Jolla Dr
- 6250 Hillside Ave
- 5796 Mountain View Ave
- 5898 Mountain View Ave
- 6140 Antioch Ave
- 6863 La Jolla Dr
- 6757 Clifford St
- 5945 Crystal Hill St
- 6025 Florence St
- 5455 Wayman St
- 6848 Holbrook Way
- 6001 Vera St
- 6985 Malibu Dr
- 5332 Walter St
- 6164 Goldenrod Ln
- 6656 Cathy Place
- 8204 Verbena Dr
- 5806 Walter St
- 5790 Walter St
- 5801 Norman Way
- 5791 Norman Way
- 5807 Norman Way
- 5812 Walter St
- 5780 Walter St
- 5781 Norman Way
- 5813 Norman Way
- 5807 Walter St
- 5791 Walter St
- 5770 Walter St
- 5813 Walter St
- 5781 Walter St
- 5771 Norman Way
- 5819 Walter St
- 5771 Walter St
- 5800 Norman Way
- 5760 Walter St
- 5800 Dean Way