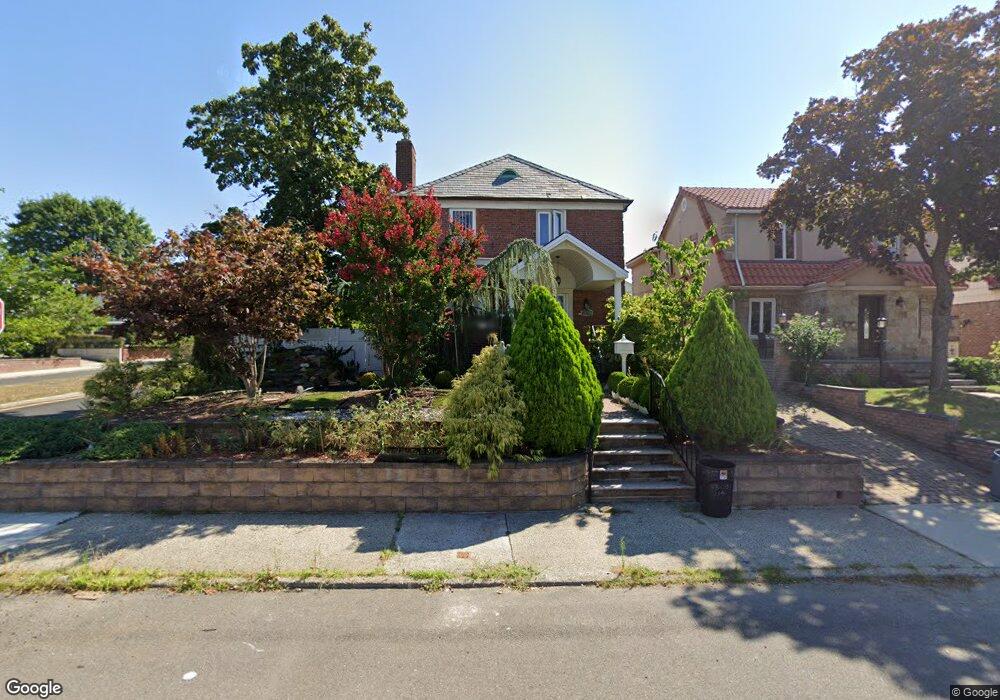
5801 214th St Flushing, NY 11364
Bayside NeighborhoodEstimated Value: $1,137,371 - $1,476,000
Studio
--
Bath
1,600
Sq Ft
$792/Sq Ft
Est. Value
About This Home
This home is located at 5801 214th St, Flushing, NY 11364 and is currently estimated at $1,266,593, approximately $791 per square foot. 5801 214th St is a home located in Queens County with nearby schools including P.S. 203 - Oakland Gardens, P.S. 376, and Nathaniel Hawthorne Middle School 74.
Ownership History
Date
Name
Owned For
Owner Type
Purchase Details
Closed on
Dec 1, 2009
Sold by
Campo Christina
Bought by
Oo Aung Khine
Current Estimated Value
Home Financials for this Owner
Home Financials are based on the most recent Mortgage that was taken out on this home.
Original Mortgage
$448,000
Outstanding Balance
$291,640
Interest Rate
5.02%
Mortgage Type
Purchase Money Mortgage
Estimated Equity
$974,953
Purchase Details
Closed on
Jun 9, 2006
Sold by
Mcdonnell Stephen
Bought by
Campo Christina
Create a Home Valuation Report for This Property
The Home Valuation Report is an in-depth analysis detailing your home's value as well as a comparison with similar homes in the area
Home Values in the Area
Average Home Value in this Area
Purchase History
| Date | Buyer | Sale Price | Title Company |
|---|---|---|---|
| Oo Aung Khine | $560,000 | -- | |
| Oo Aung Khine | $560,000 | -- | |
| Campo Christina | -- | -- | |
| Campo Christina | -- | -- |
Source: Public Records
Mortgage History
| Date | Status | Borrower | Loan Amount |
|---|---|---|---|
| Open | Oo Aung Khine | $448,000 | |
| Closed | Oo Aung Khine | $448,000 |
Source: Public Records
Tax History
| Year | Tax Paid | Tax Assessment Tax Assessment Total Assessment is a certain percentage of the fair market value that is determined by local assessors to be the total taxable value of land and additions on the property. | Land | Improvement |
|---|---|---|---|---|
| 2025 | $11,400 | $60,162 | $13,982 | $46,180 |
| 2024 | $11,400 | $56,759 | $15,164 | $41,595 |
| 2023 | $10,755 | $53,546 | $15,808 | $37,738 |
| 2022 | $10,689 | $55,320 | $17,040 | $38,280 |
| 2021 | $10,637 | $59,040 | $17,040 | $42,000 |
| 2020 | $10,612 | $64,920 | $17,040 | $47,880 |
| 2019 | $9,895 | $58,140 | $17,040 | $41,100 |
| 2018 | $9,096 | $44,622 | $11,788 | $32,834 |
| 2017 | $9,096 | $44,622 | $13,987 | $30,635 |
| 2016 | $8,420 | $44,622 | $13,987 | $30,635 |
| 2015 | $5,077 | $41,779 | $18,542 | $23,237 |
| 2014 | $5,077 | $39,416 | $14,863 | $24,553 |
Source: Public Records
Map
Nearby Homes
- 58-18 213th St
- 5636 213th St
- 58-03 212th St
- 5612 212th St
- 56-20 217th St
- 5807 210th St
- 5627 210th St
- 5631 219th St
- 6408 213th St
- 51-15 Bell Blvd
- 50-35 213th St
- 64-47 215 St
- 51-06 216th St
- 64-14 218th St
- 64-16 211th St
- 219-02 64th Ave Unit 3
- 219-36 64th Ave
- 64-46 217th St
- 224-39 Kingsbury ave Kingsbury Ave Unit A
- 50-05 212th St
Your Personal Tour Guide
Ask me questions while you tour the home.