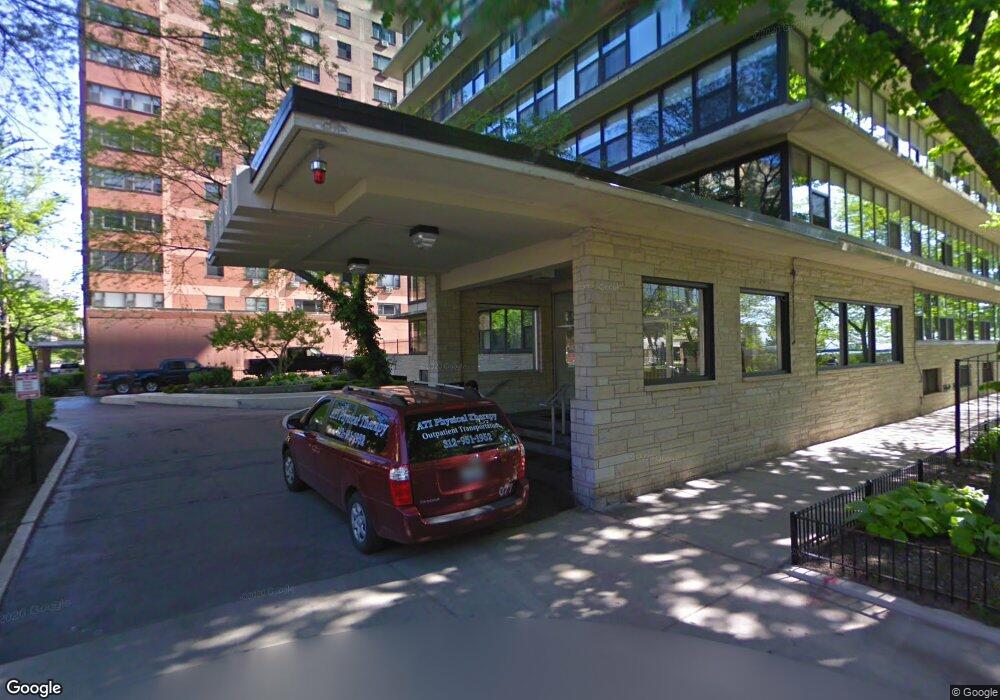
Beach Point Tower 5801 N Sheridan Rd Unit 7D Chicago, IL 60660
Edgewater NeighborhoodEstimated Value: $326,000 - $358,000
2
Beds
2
Baths
--
Sq Ft
0.53
Acres
About This Home
This home is located at 5801 N Sheridan Rd Unit 7D, Chicago, IL 60660 and is currently estimated at $340,028. 5801 N Sheridan Rd Unit 7D is a home located in Cook County with nearby schools including Senn High School, Sacred Heart Schools, and St Thomas Of Canterbury School.
Ownership History
Date
Name
Owned For
Owner Type
Purchase Details
Closed on
Mar 2, 2017
Sold by
Ghani Faizan
Bought by
Haqqani Syed Mubashar Hassan
Current Estimated Value
Purchase Details
Closed on
Jan 12, 2010
Sold by
Boyle Mary Jane and James Neil Boyle Revocable Tru
Bought by
Ghani Faizan
Home Financials for this Owner
Home Financials are based on the most recent Mortgage that was taken out on this home.
Original Mortgage
$148,000
Interest Rate
5.2%
Mortgage Type
New Conventional
Purchase Details
Closed on
Aug 2, 2001
Sold by
Boyle J Neil
Bought by
Boyle James Neil and Boyle Mary Jane
Purchase Details
Closed on
Jul 20, 1994
Sold by
Boyar Arthur K
Bought by
Boyle J Neil
Home Financials for this Owner
Home Financials are based on the most recent Mortgage that was taken out on this home.
Original Mortgage
$61,500
Interest Rate
8.41%
Create a Home Valuation Report for This Property
The Home Valuation Report is an in-depth analysis detailing your home's value as well as a comparison with similar homes in the area
Home Values in the Area
Average Home Value in this Area
Purchase History
| Date | Buyer | Sale Price | Title Company |
|---|---|---|---|
| Haqqani Syed Mubashar Hassan | -- | Attorney | |
| Ghani Faizan | $185,000 | Pntn | |
| Boyle James Neil | -- | -- | |
| Boyle J Neil | $123,000 | 1St American Title |
Source: Public Records
Mortgage History
| Date | Status | Borrower | Loan Amount |
|---|---|---|---|
| Previous Owner | Ghani Faizan | $148,000 | |
| Previous Owner | Boyle J Neil | $61,500 |
Source: Public Records
Tax History Compared to Growth
Tax History
| Year | Tax Paid | Tax Assessment Tax Assessment Total Assessment is a certain percentage of the fair market value that is determined by local assessors to be the total taxable value of land and additions on the property. | Land | Improvement |
|---|---|---|---|---|
| 2024 | $5,064 | $31,501 | $2,794 | $28,707 |
| 2023 | $4,936 | $24,000 | $2,247 | $21,753 |
| 2022 | $4,936 | $24,000 | $2,247 | $21,753 |
| 2021 | $4,826 | $23,999 | $2,246 | $21,753 |
| 2020 | $4,063 | $18,237 | $1,291 | $16,946 |
| 2019 | $4,054 | $20,179 | $1,291 | $18,888 |
| 2018 | $3,986 | $20,179 | $1,291 | $18,888 |
| 2017 | $3,363 | $15,624 | $1,123 | $14,501 |
| 2016 | $3,129 | $15,624 | $1,123 | $14,501 |
| 2015 | $2,863 | $15,624 | $1,123 | $14,501 |
| 2014 | $2,827 | $15,239 | $856 | $14,383 |
| 2013 | $2,772 | $15,239 | $856 | $14,383 |
Source: Public Records
About Beach Point Tower
Map
Nearby Homes
- 5801 N Sheridan Rd Unit 8A
- 5757 N Sheridan Rd Unit 5J
- 5757 N Sheridan Rd Unit 18J
- 5757 N Sheridan Rd Unit 3J
- 5747 N Sheridan Rd Unit GH
- 5733 N Sheridan Rd Unit 23B
- 5733 N Sheridan Rd Unit 28D
- 5733 N Sheridan Rd Unit 27C
- 5733 N Sheridan Rd Unit 28B
- 5855 N Sheridan Rd Unit 9F
- 5701 N Sheridan Rd Unit 10Q
- 5701 N Sheridan Rd Unit 9T
- 5701 N Sheridan Rd Unit 29N
- 5701 N Sheridan Rd Unit 26B
- 5901 N Sheridan Rd Unit 9G
- 5863 N Kenmore Ave Unit 2
- 5728 N Kenmore Ave Unit GN
- 5854 N Kenmore Ave Unit 2B
- 5818 N Winthrop Ave Unit 4
- 5953 N Kenmore Ave Unit 404
- 5801 N Sheridan Rd Unit 3E
- 5801 N Sheridan Rd Unit 6C
- 5801 N Sheridan Rd Unit 16B
- 5801 N Sheridan Rd Unit 4C
- 5801 N Sheridan Rd Unit 18D
- 5801 N Sheridan Rd Unit 9D
- 5801 N Sheridan Rd Unit 20D
- 5801 N Sheridan Rd Unit 15C
- 5801 N Sheridan Rd Unit 5A
- 5801 N Sheridan Rd Unit 3D
- 5801 N Sheridan Rd Unit 10E
- 5801 N Sheridan Rd Unit 3A
- 5801 N Sheridan Rd Unit 11A
- 5801 N Sheridan Rd Unit 3B
- 5801 N Sheridan Rd Unit 17E
- 5801 N Sheridan Rd Unit 14E
- 5801 N Sheridan Rd Unit 6E
- 5801 N Sheridan Rd Unit 5E
- 5801 N Sheridan Rd Unit 5D
- 5801 N Sheridan Rd Unit 16C