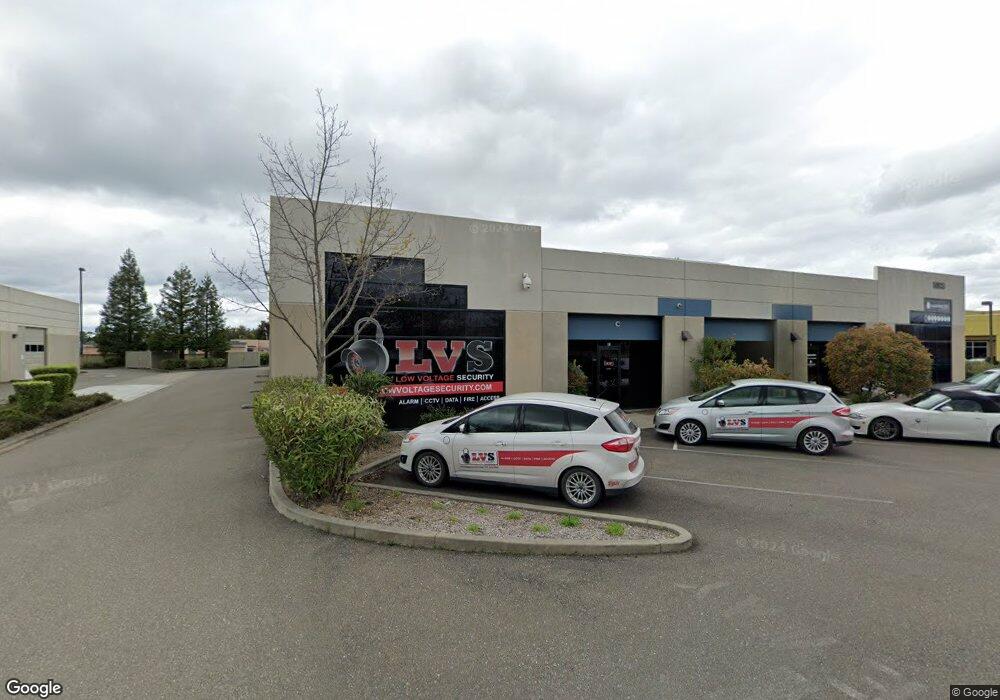
5803 Skylane Blvd Windsor, CA 95492
Estimated Value: $2,988,211
Studio
--
Bath
15,814
Sq Ft
$189/Sq Ft
Est. Value
About This Home
This home is located at 5803 Skylane Blvd, Windsor, CA 95492 and is currently estimated at $2,988,211, approximately $188 per square foot. 5803 Skylane Blvd is a home located in Sonoma County with nearby schools including Mattie Washburn Elementary School, Brooks Elementary School, and Windsor Middle School.
Ownership History
Date
Name
Owned For
Owner Type
Purchase Details
Closed on
Sep 11, 2022
Sold by
Pacatte Properties Llc
Bought by
Trinity Systems Llc
Current Estimated Value
Home Financials for this Owner
Home Financials are based on the most recent Mortgage that was taken out on this home.
Original Mortgage
$1,194,000
Outstanding Balance
$1,134,780
Interest Rate
5.3%
Estimated Equity
$1,853,431
Purchase Details
Closed on
Sep 6, 2016
Sold by
Pacatte James L and Pacatte Rosemarie E
Bought by
Pacatte Properties Llc
Purchase Details
Closed on
Jun 21, 2016
Sold by
Pacatte James L and Pacatte Rosemarie E
Bought by
Pacatte Douglas and Graveson Dawn
Purchase Details
Closed on
Jun 17, 2003
Sold by
Pacatte James L and Pacatte Rosemarie E
Bought by
Pacatte Properties Llc
Purchase Details
Closed on
Sep 23, 1999
Sold by
Airport Business Center
Bought by
Pacatte James L and Pacatte Rosemarie E
Create a Home Valuation Report for This Property
The Home Valuation Report is an in-depth analysis detailing your home's value as well as a comparison with similar homes in the area
Home Values in the Area
Average Home Value in this Area
Purchase History
| Date | Buyer | Sale Price | Title Company |
|---|---|---|---|
| Trinity Systems Llc | $2,800,000 | Fidelity National Title | |
| Pacatte Properties Llc | -- | None Available | |
| Pacatte Douglas | -- | None Available | |
| Pacatte James L | -- | None Available | |
| Pacatte Properties Llc | -- | -- | |
| Pacatte James L | -- | Northwestern Title Company |
Source: Public Records
Mortgage History
| Date | Status | Borrower | Loan Amount |
|---|---|---|---|
| Open | Trinity Systems Llc | $1,194,000 | |
| Closed | Trinity Systems Llc | $1,450,000 |
Source: Public Records
Tax History
| Year | Tax Paid | Tax Assessment Tax Assessment Total Assessment is a certain percentage of the fair market value that is determined by local assessors to be the total taxable value of land and additions on the property. | Land | Improvement |
|---|---|---|---|---|
| 2025 | $18,098 | $2,913,120 | $884,340 | $2,028,780 |
| 2024 | $18,098 | $1,330,460 | $473,606 | $856,854 |
| 2023 | $18,098 | $1,304,373 | $464,320 | $840,053 |
| 2022 | $17,314 | $1,278,798 | $455,216 | $823,582 |
| 2021 | $16,981 | $1,253,725 | $446,291 | $807,434 |
| 2020 | $17,275 | $1,240,870 | $441,715 | $799,155 |
| 2019 | $17,204 | $1,216,540 | $433,054 | $783,486 |
| 2018 | $17,163 | $1,192,687 | $424,563 | $768,124 |
| 2017 | $16,866 | $1,169,302 | $416,239 | $753,063 |
| 2016 | $16,239 | $1,146,376 | $408,078 | $738,298 |
| 2015 | $15,823 | $1,129,158 | $401,949 | $727,209 |
| 2014 | $15,583 | $1,107,040 | $394,076 | $712,964 |
Source: Public Records
Map
Nearby Homes
- 1349 Golf Course Dr
- 60 Shiloh Rd
- 7225 16th Hole Dr
- 705 Shiloh Rd
- 1332 Eagle Dr
- 333 Cornell Stree
- 345 Wilson Ln
- 140 Billington Ln
- 6133 Tamara Ln
- 172 Cornell St
- 8148 D St
- 8156 D St
- 8109 B St
- 6283 Old Redwood Hwy
- 7830 Foppiano Way
- 153 Bari Ln
- 8145 Willow St
- 8147 Willow St
- 129 Amanda Way
- 1038 Capewood Ln
- 5803 Skylane Blvd Unit B
- 5803 Skylane Blvd Unit A-2
- 5803 Skylane Blvd Unit F
- 5793 Skylane Blvd
- 5793 Skylane Blvd Unit B
- 5813 Skylane Blvd
- 1200 Shiloh Rd
- 1086 Shiloh Rd
- 1246 Shiloh Rd
- 1090 Shiloh Rd
- 1264 Shiloh Rd
- 5770 Skylane Blvd
- 1346 Shiloh Rd
- 950 Shiloh Rd
- 1340 Sanders Rd
- 1446 Shiloh Rd
- 7215 Conde Ln
- 1399 Sanders Rd
- 1343 Golf Course Dr
- 1300 Shiloh Rd
Your Personal Tour Guide
Ask me questions while you tour the home.