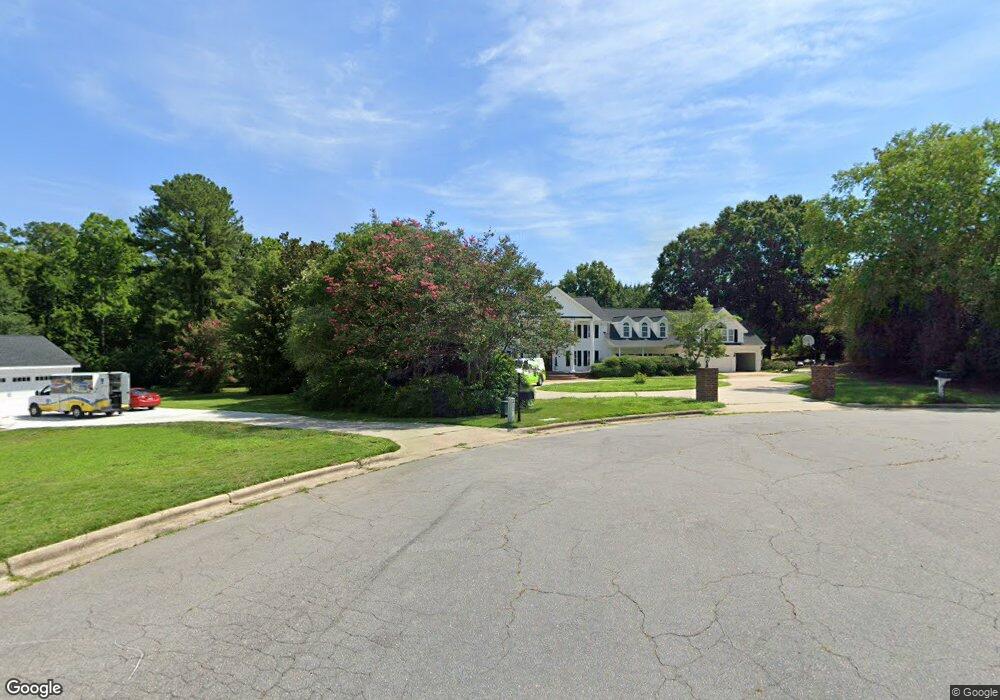
5808 Devon Cir Raleigh, NC 27604
Northeast Raleigh NeighborhoodEstimated Value: $818,000 - $1,150,000
6
Beds
4
Baths
5,408
Sq Ft
$181/Sq Ft
Est. Value
About This Home
This home is located at 5808 Devon Cir, Raleigh, NC 27604 and is currently estimated at $979,443, approximately $181 per square foot. 5808 Devon Cir is a home located in Wake County with nearby schools including Beaverdam Elementary School, River Bend Middle, and Rolesville High School.
Ownership History
Date
Name
Owned For
Owner Type
Purchase Details
Closed on
Jul 26, 2021
Sold by
James Michael E and James Linda
Bought by
James Linda
Current Estimated Value
Purchase Details
Closed on
Oct 28, 2005
Sold by
Hoke Adam and Hoke Laurie
Bought by
James Michael E and James Linda
Home Financials for this Owner
Home Financials are based on the most recent Mortgage that was taken out on this home.
Original Mortgage
$430,000
Outstanding Balance
$232,716
Interest Rate
5.84%
Mortgage Type
Fannie Mae Freddie Mac
Estimated Equity
$746,727
Purchase Details
Closed on
Mar 28, 2005
Sold by
Register Terry Gene and Register Grace Jackson
Bought by
Hoke Adam and Hoke Laurie
Home Financials for this Owner
Home Financials are based on the most recent Mortgage that was taken out on this home.
Original Mortgage
$434,400
Interest Rate
5.99%
Mortgage Type
Fannie Mae Freddie Mac
Create a Home Valuation Report for This Property
The Home Valuation Report is an in-depth analysis detailing your home's value as well as a comparison with similar homes in the area
Home Values in the Area
Average Home Value in this Area
Purchase History
| Date | Buyer | Sale Price | Title Company |
|---|---|---|---|
| James Linda | -- | None Available | |
| James Michael E | $580,000 | None Available | |
| Hoke Adam | $541,000 | -- |
Source: Public Records
Mortgage History
| Date | Status | Borrower | Loan Amount |
|---|---|---|---|
| Open | James Michael E | $430,000 | |
| Previous Owner | Hoke Adam | $434,400 | |
| Closed | Hoke Adam | $108,600 |
Source: Public Records
Tax History
| Year | Tax Paid | Tax Assessment Tax Assessment Total Assessment is a certain percentage of the fair market value that is determined by local assessors to be the total taxable value of land and additions on the property. | Land | Improvement |
|---|---|---|---|---|
| 2025 | $6,007 | $936,075 | $145,000 | $791,075 |
| 2024 | $5,833 | $936,075 | $145,000 | $791,075 |
| 2023 | $5,009 | $639,836 | $110,000 | $529,836 |
| 2022 | $4,641 | $639,836 | $110,000 | $529,836 |
| 2021 | $4,516 | $639,836 | $110,000 | $529,836 |
| 2020 | $4,441 | $639,836 | $110,000 | $529,836 |
| 2019 | $4,345 | $529,532 | $110,000 | $419,532 |
| 2018 | $3,994 | $529,532 | $110,000 | $419,532 |
| 2017 | $3,785 | $529,532 | $110,000 | $419,532 |
| 2016 | $3,708 | $529,532 | $110,000 | $419,532 |
| 2015 | $4,268 | $611,689 | $130,000 | $481,689 |
| 2014 | $4,045 | $611,689 | $130,000 | $481,689 |
Source: Public Records
Map
Nearby Homes
- 5708 Castlebrook Dr
- 3409 S Beaver Ln
- 2349 Sapphire Valley Dr
- 5525 Buffaloe Rd
- 3908 Hyson Place
- 2001 Metacomet Way
- 3336 Holly Lake Trail
- 4139 Davis Meadow St
- 4614 Clove Meadow Ct
- 3748 Charleston Park Dr
- 2044 Muirfield Village Way
- 2129 Ventana Ln
- 2125 Ventana Ln
- 2215 Turtle Point Dr
- 5017 Casland Dr
- 2331 Whistling Straits Way
- 4465 Cardinal Grove Blvd
- 5351 Cog Hill Ct
- 4249 Saubranch Hill St
- 4416 Walker Hallow St
- 5817 Devon Cir
- 5320 Edington Ln
- 5408 Edington Ln
- 5404 Edington Ln
- 5316 Edington Ln
- 5324 Edington Ln
- 5813 Devon Cir
- 5412 Edington Ln
- 5809 Devon Cir
- 5312 Edington Ln
- 5328 Edington Ln
- 5805 Devon Cir
- 5704 Castlebrook Dr
- 5317 Edington Ln
- 5308 Edington Ln
- 5325 Edington Ln
- 5321 Edington Ln
- 5421 Edington Ln
- 5801 Devon Cir
- 5417 Edington Ln
Your Personal Tour Guide
Ask me questions while you tour the home.