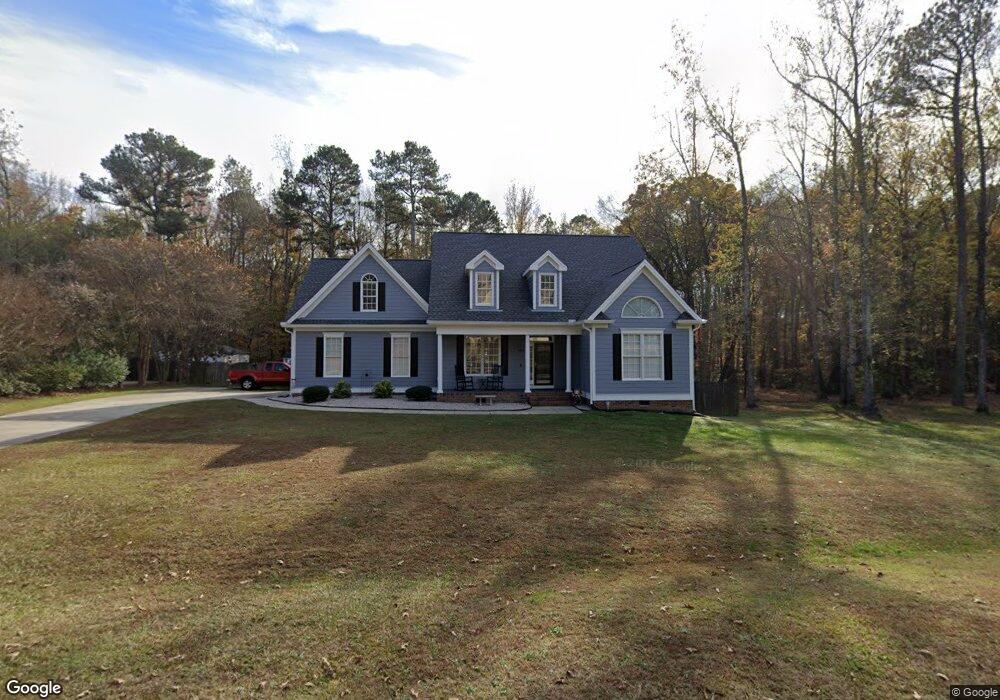
5808 Enchanted Creek Cir Knightdale, NC 27545
Shotwell NeighborhoodEstimated Value: $441,835 - $473,000
3
Beds
3
Baths
2,477
Sq Ft
$184/Sq Ft
Est. Value
About This Home
This home is located at 5808 Enchanted Creek Cir, Knightdale, NC 27545 and is currently estimated at $456,959, approximately $184 per square foot. 5808 Enchanted Creek Cir is a home located in Wake County with nearby schools including Lake Myra Elementary, Wendell Middle School, and East Wake High School.
Ownership History
Date
Name
Owned For
Owner Type
Purchase Details
Closed on
Oct 10, 2017
Sold by
Mcdaniel Amy
Bought by
Steeber Mark F and Steeber Jodie Ann
Current Estimated Value
Home Financials for this Owner
Home Financials are based on the most recent Mortgage that was taken out on this home.
Original Mortgage
$100,000
Outstanding Balance
$83,438
Interest Rate
3.78%
Mortgage Type
New Conventional
Estimated Equity
$373,521
Purchase Details
Closed on
Aug 1, 2017
Sold by
Mcdaniel Billy
Bought by
Mcdaniel Amy
Purchase Details
Closed on
Aug 23, 2002
Sold by
Manning Homes Inc
Bought by
Mcdaniel Billy and Mcdaniel Amy
Home Financials for this Owner
Home Financials are based on the most recent Mortgage that was taken out on this home.
Original Mortgage
$220,300
Interest Rate
6.53%
Create a Home Valuation Report for This Property
The Home Valuation Report is an in-depth analysis detailing your home's value as well as a comparison with similar homes in the area
Home Values in the Area
Average Home Value in this Area
Purchase History
| Date | Buyer | Sale Price | Title Company |
|---|---|---|---|
| Steeber Mark F | $270,000 | None Available | |
| Mcdaniel Amy | -- | None Available | |
| Mcdaniel Billy | $232,000 | -- |
Source: Public Records
Mortgage History
| Date | Status | Borrower | Loan Amount |
|---|---|---|---|
| Open | Steeber Mark F | $100,000 | |
| Previous Owner | Mcdaniel Billy | $220,300 |
Source: Public Records
Tax History Compared to Growth
Tax History
| Year | Tax Paid | Tax Assessment Tax Assessment Total Assessment is a certain percentage of the fair market value that is determined by local assessors to be the total taxable value of land and additions on the property. | Land | Improvement |
|---|---|---|---|---|
| 2025 | $2,713 | $421,015 | $85,000 | $336,015 |
| 2024 | $2,635 | $421,015 | $85,000 | $336,015 |
| 2023 | $2,372 | $301,681 | $44,000 | $257,681 |
| 2022 | $2,199 | $301,681 | $44,000 | $257,681 |
| 2021 | $2,140 | $301,681 | $44,000 | $257,681 |
| 2020 | $2,105 | $301,681 | $44,000 | $257,681 |
| 2019 | $1,960 | $237,571 | $40,000 | $197,571 |
| 2018 | $1,803 | $237,571 | $40,000 | $197,571 |
| 2017 | $1,709 | $237,571 | $40,000 | $197,571 |
| 2016 | $1,675 | $237,571 | $40,000 | $197,571 |
| 2015 | $1,762 | $250,829 | $44,000 | $206,829 |
| 2014 | $1,670 | $250,829 | $44,000 | $206,829 |
Source: Public Records
Map
Nearby Homes
- 1417 White Opal Dr
- 1417 Slate Ridge Rd
- 5312 Sapphire Springs Dr
- 1157 Rutledge Landing Dr
- 920 Knotts Hill Place
- 5212 Sapphire Springs Dr
- 1128 Rutledge Landing Dr
- 5104 Parkerwood Dr
- 5200 Limewood St
- 5209 Limewood St
- 1417 Stone Wealth Dr
- 4920 Stonewood Pines Dr
- 1240 Sweetgrass St
- 6220 Turnipseed Rd
- 5404 Rutledgeville Ln
- 5509 Sandy Run
- 4600 Smithfield Rd
- 102 N Bend Dr
- 4620 Smithfield Rd
- 105 N Bend Dr
- 5814 Enchanted Creek Cir
- 5804 Enchanted Creek Cir
- 5805 Enchanted Creek Cir
- 5800 Enchanted Creek Cir
- 5817 Enchanted Creek Cir
- 5801 Enchanted Creek Cir
- 5818 Enchanted Creek Cir
- 1406 Farm Fence Dr
- 1400 Farm Fence Dr
- 1412 Farm Fence Dr
- 1416 Farm Fence Dr
- 1228 Golden Field Dr
- 5822 Enchanted Creek Cir
- 1232 Golden Field Dr
- 1405 Farm Fence Dr
- 5622 Old Forest Cir
- 5628 Old Forest Cir
- 5828 Enchanted Creek Cir
- 5618 Old Forest Cir
- 1231 Golden Field Dr