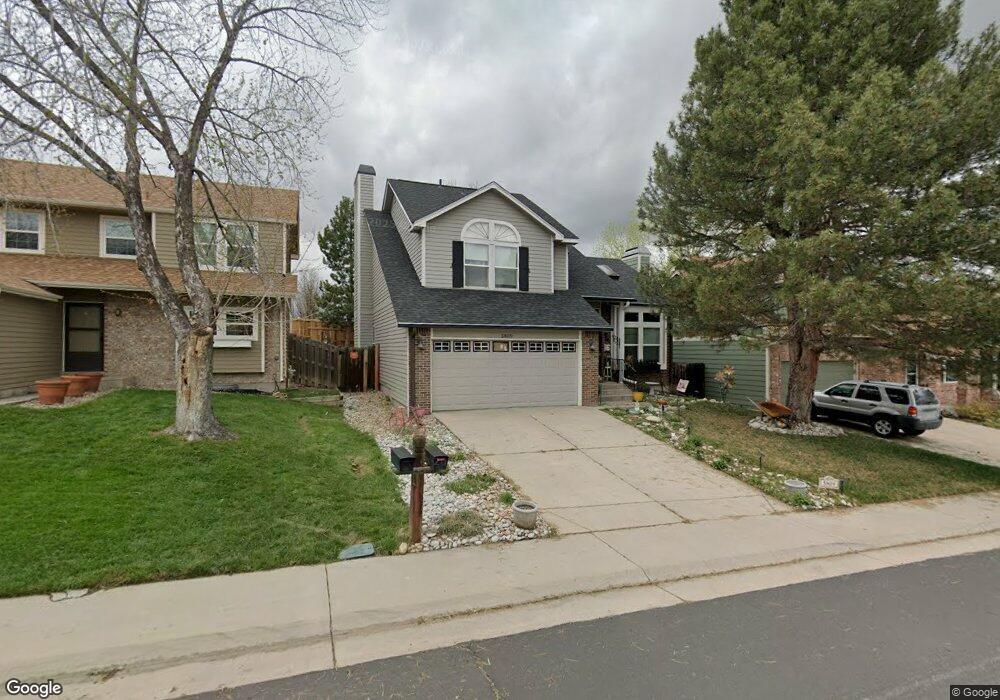
5809 S Jebel Way Centennial, CO 80015
Park View NeighborhoodEstimated Value: $509,000 - $520,000
3
Beds
4
Baths
1,668
Sq Ft
$308/Sq Ft
Est. Value
About This Home
This home is located at 5809 S Jebel Way, Centennial, CO 80015 and is currently estimated at $514,530, approximately $308 per square foot. 5809 S Jebel Way is a home located in Arapahoe County with nearby schools including Timberline Elementary School, Thunder Ridge Middle School, and Eaglecrest High School.
Ownership History
Date
Name
Owned For
Owner Type
Purchase Details
Closed on
Sep 12, 2011
Sold by
Dubois Greg A and Dubois Michele R
Bought by
Dubois Greg A and Dubois Michele R
Current Estimated Value
Purchase Details
Closed on
Sep 26, 1995
Sold by
Faller Beth A and Squire Kelli L
Bought by
Dubois Greg A and Cincinatus Dubois Michele R
Home Financials for this Owner
Home Financials are based on the most recent Mortgage that was taken out on this home.
Original Mortgage
$130,368
Interest Rate
7.88%
Mortgage Type
FHA
Purchase Details
Closed on
Nov 30, 1992
Sold by
Conversion Arapco
Bought by
Faller Beth A and Mercer Kelli L
Purchase Details
Closed on
Feb 1, 1986
Sold by
Conversion Arapco
Bought by
Conversion Arapco
Purchase Details
Closed on
Apr 1, 1985
Bought by
Conversion Arapco
Create a Home Valuation Report for This Property
The Home Valuation Report is an in-depth analysis detailing your home's value as well as a comparison with similar homes in the area
Home Values in the Area
Average Home Value in this Area
Purchase History
| Date | Buyer | Sale Price | Title Company |
|---|---|---|---|
| Dubois Greg A | -- | None Available | |
| Dubois Greg A | $137,500 | Title America | |
| Faller Beth A | -- | -- | |
| Conversion Arapco | -- | -- | |
| Conversion Arapco | -- | -- |
Source: Public Records
Mortgage History
| Date | Status | Borrower | Loan Amount |
|---|---|---|---|
| Closed | Dubois Greg A | $130,368 |
Source: Public Records
Tax History
| Year | Tax Paid | Tax Assessment Tax Assessment Total Assessment is a certain percentage of the fair market value that is determined by local assessors to be the total taxable value of land and additions on the property. | Land | Improvement |
|---|---|---|---|---|
| 2025 | $2,847 | $33,231 | -- | -- |
| 2024 | $3,141 | $33,594 | -- | -- |
| 2023 | $3,141 | $33,594 | $0 | $0 |
| 2022 | $2,527 | $25,479 | $0 | $0 |
| 2021 | $2,537 | $25,479 | $0 | $0 |
| 2020 | $2,637 | $27,070 | $0 | $0 |
| 2019 | $2,544 | $27,070 | $0 | $0 |
| 2018 | $2,174 | $20,585 | $0 | $0 |
| 2017 | $2,137 | $20,585 | $0 | $0 |
| 2016 | $1,915 | $17,440 | $0 | $0 |
| 2015 | $1,849 | $17,440 | $0 | $0 |
| 2014 | -- | $14,272 | $0 | $0 |
| 2013 | -- | $15,010 | $0 | $0 |
Source: Public Records
Map
Nearby Homes
- 5849 S Jebel Way
- 5738 N Jebel Way
- 5726 N Jebel Way
- 20426 E Orchard Place
- 20339 E Powers Place
- 20273 E Lake Cir
- 20786 E Powers Cir
- 20568 E Lake Place
- 20532 E Lake Cir
- 5716 S Lisbon Way
- 19978 E Garden Dr
- 5628 S Ensenada Ct
- 5860 S Espana St
- 19485 E Powers Place
- 21238 E Powers Place
- 5915 S Nepal St
- 21268 E Powers Place
- 5523 S Malta St
- 5305 S Ireland Way
- 5503 S Malta St
- 5805 S Jebel Way
- 5815 S Jebel Way
- 5793 S Jebel Way
- 5819 S Jebel Way
- 5783 S Jebel Way
- 5806 S Jebel Way
- 5816 S Jebel Way
- 5825 S Jebel Way
- 5794 S Jebel Way
- 5784 S Jebel Way
- 5777 S Jebel Way
- 5829 S Jebel Way
- 5836 S Jebel Way
- 5778 S Jebel Way
- 5773 S Jebel Way
- 5811 S Jericho Way
- 5817 S Jericho Way
- 5774 S Jebel Way
- 5807 S Jericho Way
- 5835 S Jebel Way
Your Personal Tour Guide
Ask me questions while you tour the home.