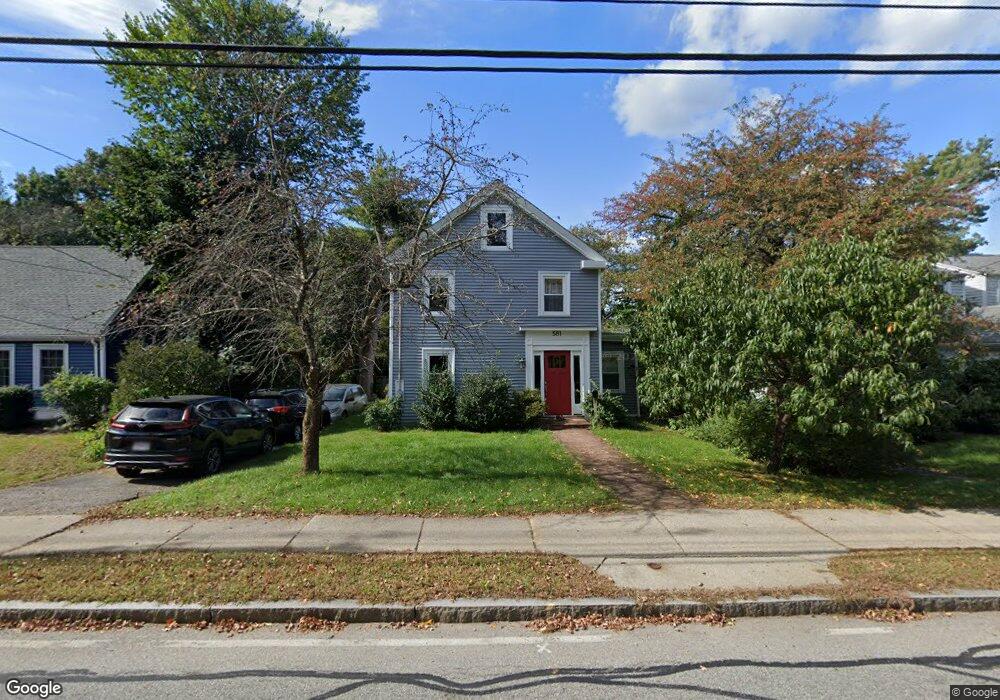
581 Grove St Newton Lower Falls, MA 02462
Newton Lower Falls NeighborhoodEstimated Value: $1,185,039 - $1,371,000
4
Beds
2
Baths
2,000
Sq Ft
$639/Sq Ft
Est. Value
About This Home
This home is located at 581 Grove St, Newton Lower Falls, MA 02462 and is currently estimated at $1,278,260, approximately $639 per square foot. 581 Grove St is a home located in Middlesex County with nearby schools including Angier Elementary School, Charles E Brown Middle School, and Newton South High School.
Ownership History
Date
Name
Owned For
Owner Type
Purchase Details
Closed on
Jul 30, 2019
Sold by
Peng Xinqun
Bought by
Peng Xinqun and Xu Mousheng
Current Estimated Value
Home Financials for this Owner
Home Financials are based on the most recent Mortgage that was taken out on this home.
Original Mortgage
$343,000
Outstanding Balance
$299,098
Interest Rate
3.7%
Mortgage Type
New Conventional
Estimated Equity
$979,162
Purchase Details
Closed on
Jul 15, 2004
Sold by
Rawlings Nancy W and Rawlings Raymond W
Bought by
Peng Xinqun
Create a Home Valuation Report for This Property
The Home Valuation Report is an in-depth analysis detailing your home's value as well as a comparison with similar homes in the area
Home Values in the Area
Average Home Value in this Area
Purchase History
| Date | Buyer | Sale Price | Title Company |
|---|---|---|---|
| Peng Xinqun | -- | -- | |
| Peng Xinqun | $549,400 | -- | |
| Peng Xinqun | $549,400 | -- |
Source: Public Records
Mortgage History
| Date | Status | Borrower | Loan Amount |
|---|---|---|---|
| Open | Peng Xinqun | $343,000 | |
| Previous Owner | Peng Xinqun | $407,800 | |
| Previous Owner | Peng Xinqun | $410,000 | |
| Previous Owner | Peng Xinqun | $410,000 |
Source: Public Records
Tax History Compared to Growth
Tax History
| Year | Tax Paid | Tax Assessment Tax Assessment Total Assessment is a certain percentage of the fair market value that is determined by local assessors to be the total taxable value of land and additions on the property. | Land | Improvement |
|---|---|---|---|---|
| 2025 | $8,917 | $909,900 | $733,400 | $176,500 |
| 2024 | $8,622 | $883,400 | $712,000 | $171,400 |
| 2023 | $8,057 | $791,500 | $546,200 | $245,300 |
| 2022 | $7,710 | $732,900 | $505,700 | $227,200 |
| 2021 | $7,439 | $691,400 | $477,100 | $214,300 |
| 2020 | $7,218 | $691,400 | $477,100 | $214,300 |
| 2019 | $7,015 | $671,300 | $463,200 | $208,100 |
| 2018 | $6,613 | $611,200 | $416,300 | $194,900 |
| 2017 | $6,412 | $576,600 | $392,700 | $183,900 |
| 2016 | $6,133 | $538,900 | $367,000 | $171,900 |
| 2015 | $5,847 | $503,600 | $343,000 | $160,600 |
Source: Public Records
Map
Nearby Homes
- 45 Moulton St
- 25 Columbia St
- 17 Deforest Rd
- 7 Crescent St
- 45 E Quinobequin Rd
- 2084 Washington St
- 34 Palmer Rd
- 2 Longfellow Rd
- 177 Varick Rd
- 12 Bird Hill Ave
- 8 Old Town Rd
- 27 Oakwood Rd
- 10 Lorraine Cir
- 135 Orchard Ave
- 41 Orchard Ave
- 20 Oakland Street Front
- 33 Metacomet Rd
- 54 Colburn Rd
- 17 Lasell St
- 1801 Beacon St
- 581 Grove St Unit 581
- 585 Grove St
- 577 Grove St
- 577 Grove St Unit 1
- 91 Cornell St
- 595 Grove St
- 574 Grove St Unit 576
- 574 Grove St
- 584 Grove St
- 590 Grove St
- 85 Cornell St
- 599 Grove St
- 599 Grove St Unit 2
- 599 Grove St Unit 1
- 121 Cornell St
- 596 Grove St
- 566 Grove St
- 32 Swallow Dr
- 605 Grove St
- 77 Cornell St