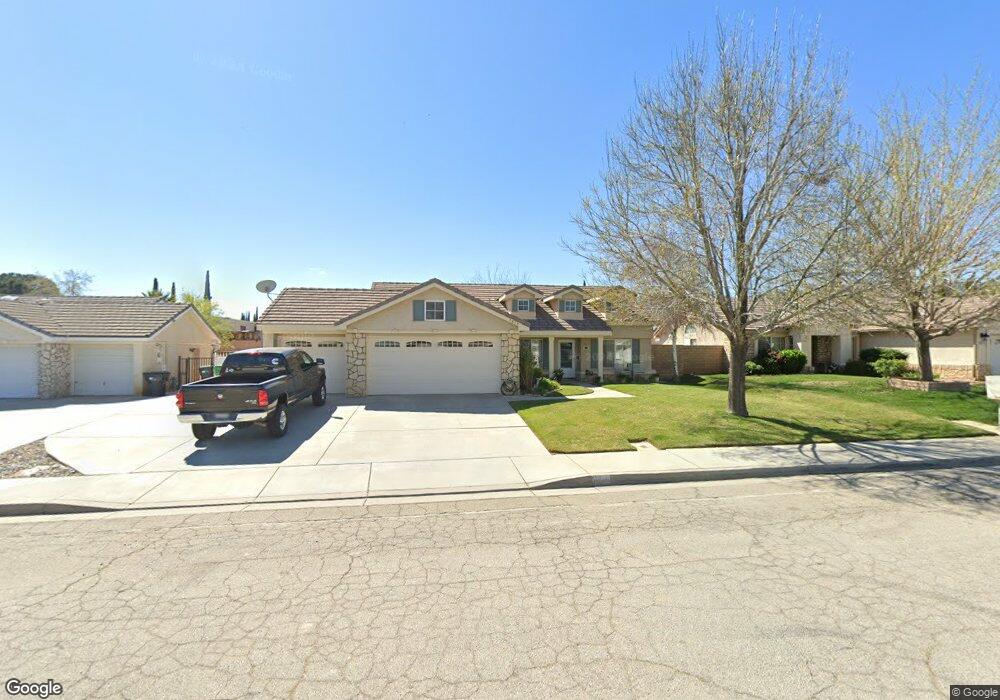
5810 Travis Paul Dr Lancaster, CA 93536
West Lancaster NeighborhoodEstimated Value: $513,000 - $540,000
4
Beds
2
Baths
1,711
Sq Ft
$307/Sq Ft
Est. Value
About This Home
This home is located at 5810 Travis Paul Dr, Lancaster, CA 93536 and is currently estimated at $525,609, approximately $307 per square foot. 5810 Travis Paul Dr is a home located in Los Angeles County with nearby schools including Quartz Hill Elementary School, Joe Walker Middle School, and Quartz Hill High School.
Ownership History
Date
Name
Owned For
Owner Type
Purchase Details
Closed on
Oct 9, 2024
Sold by
Roadhouse Bruce J and Roadhouse Stacey
Bought by
Roadhouse Bruce J
Current Estimated Value
Home Financials for this Owner
Home Financials are based on the most recent Mortgage that was taken out on this home.
Original Mortgage
$335,000
Outstanding Balance
$331,301
Interest Rate
6.09%
Mortgage Type
New Conventional
Estimated Equity
$194,308
Purchase Details
Closed on
Apr 28, 1999
Sold by
Chavez Manuel C and The Chavez Family Trust
Bought by
Roadhouse Bruce J and Roadhouse Stacey
Home Financials for this Owner
Home Financials are based on the most recent Mortgage that was taken out on this home.
Original Mortgage
$133,375
Interest Rate
6.92%
Purchase Details
Closed on
May 9, 1998
Sold by
Chavez Manuel C and Chavez Frances
Bought by
Chavez Manuel C and Chavez Frances
Create a Home Valuation Report for This Property
The Home Valuation Report is an in-depth analysis detailing your home's value as well as a comparison with similar homes in the area
Home Values in the Area
Average Home Value in this Area
Purchase History
| Date | Buyer | Sale Price | Title Company |
|---|---|---|---|
| Roadhouse Bruce J | $250,000 | Vylla Title | |
| Roadhouse Bruce J | $137,500 | Chicago Title | |
| Chavez Manuel C | -- | Chicago Title Co |
Source: Public Records
Mortgage History
| Date | Status | Borrower | Loan Amount |
|---|---|---|---|
| Open | Roadhouse Bruce J | $335,000 | |
| Previous Owner | Roadhouse Bruce J | $133,375 |
Source: Public Records
Tax History
| Year | Tax Paid | Tax Assessment Tax Assessment Total Assessment is a certain percentage of the fair market value that is determined by local assessors to be the total taxable value of land and additions on the property. | Land | Improvement |
|---|---|---|---|---|
| 2025 | $4,051 | $495,000 | $123,700 | $371,300 |
| 2024 | $4,051 | $211,304 | $42,252 | $169,052 |
| 2023 | $4,006 | $207,162 | $41,424 | $165,738 |
| 2022 | $3,811 | $203,101 | $40,612 | $162,489 |
| 2021 | $3,413 | $199,119 | $39,816 | $159,303 |
| 2019 | $3,335 | $193,215 | $38,636 | $154,579 |
| 2018 | $3,241 | $189,428 | $37,879 | $151,549 |
| 2016 | $3,078 | $182,074 | $36,409 | $145,665 |
| 2015 | $3,045 | $179,340 | $35,863 | $143,477 |
| 2014 | $3,039 | $175,828 | $35,161 | $140,667 |
Source: Public Records
Map
Nearby Homes
- 42238 58th St W
- 5813 W Avenue l11
- 42129 Madison Ct
- 42144 Madison Ct
- 5840 Almond Valley Way
- 5711 Columbia Way Unit 163
- 5711 Columbia Way Unit Spc 137
- 5711 Columbia Way Unit Spc 80
- 5711 Columbia Way Unit Spc 99
- 5711 Columbia Way Unit 23
- 5711 Columbia Way Unit 96
- 5711 Columbia Way Unit Spc 123
- 5711 Columbia Way Unit Sp72
- 5711 Columbia Way Unit 96
- 5711 Columbia Way Unit 229
- 42118 Tropez Dr
- 42307 61st St W
- 42136 55th St W
- 42443 56th St W
- 42519 Cinnabar Ct
- 5818 Travis Paul Dr
- 5804 Travis Paul Dr
- 5826 Travis Paul Dr
- 5800 Travis Paul Dr
- 5811 Travis Paul Dr
- 5803 Travis Paul Dr
- 5834 Travis Paul Dr
- 42214 58th St W
- 5827 Travis Paul Dr
- 42222 58th St W
- 5842 Travis Paul Dr
- 5837 Travis Paul Dr
- 5812 W Avenue l11
- 42230 58th St W
- 5804 W Avenue l11
- 5820 W Avenue l11
- 42205 57th St W
- 42213 57th St W
- 42213 57th St Quartz Hill
- 5828 W Avenue l11
Your Personal Tour Guide
Ask me questions while you tour the home.