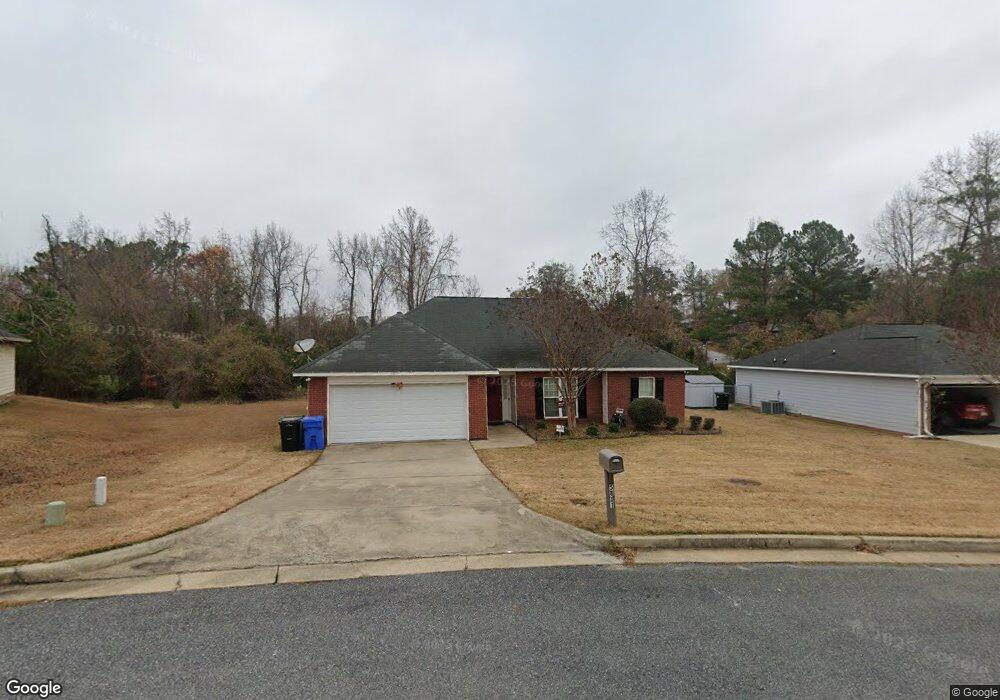
5811 Glenmere Dr Columbus, GA 31907
Eastern Columbus NeighborhoodEstimated Value: $199,000 - $210,102
4
Beds
3
Baths
1,607
Sq Ft
$126/Sq Ft
Est. Value
About This Home
This home is located at 5811 Glenmere Dr, Columbus, GA 31907 and is currently estimated at $203,026, approximately $126 per square foot. 5811 Glenmere Dr is a home located in Muscogee County with nearby schools including Wesley Heights Elementary School, Fort Middle School, and Kendrick High School.
Ownership History
Date
Name
Owned For
Owner Type
Purchase Details
Closed on
Jul 7, 2021
Sold by
Axom Teirra D
Bought by
Bynam Teirra D and Bynam Brandon Jamal
Current Estimated Value
Purchase Details
Closed on
Sep 27, 2018
Sold by
House Flip Columbus Llc
Bought by
Axom Teirra D
Home Financials for this Owner
Home Financials are based on the most recent Mortgage that was taken out on this home.
Original Mortgage
$122,735
Interest Rate
5.12%
Mortgage Type
FHA
Purchase Details
Closed on
May 24, 2018
Sold by
Sec Of Veterans Affairs
Bought by
House Flip Columbus Llc
Purchase Details
Closed on
Dec 28, 2017
Sold by
Planet Home Lending Llc
Bought by
Secretary Of Veterans Affairs
Purchase Details
Closed on
Nov 7, 2017
Sold by
Carson Brandon Joseph
Bought by
Planet Home Lending Llc
Create a Home Valuation Report for This Property
The Home Valuation Report is an in-depth analysis detailing your home's value as well as a comparison with similar homes in the area
Home Values in the Area
Average Home Value in this Area
Purchase History
| Date | Buyer | Sale Price | Title Company |
|---|---|---|---|
| Bynam Teirra D | -- | -- | |
| Axom Teirra D | $125,000 | -- | |
| House Flip Columbus Llc | $78,400 | -- | |
| Secretary Of Veterans Affairs | $79,848 | -- | |
| Planet Home Lending Llc | $79,848 | -- |
Source: Public Records
Mortgage History
| Date | Status | Borrower | Loan Amount |
|---|---|---|---|
| Previous Owner | Axom Teirra D | $122,735 |
Source: Public Records
Tax History Compared to Growth
Tax History
| Year | Tax Paid | Tax Assessment Tax Assessment Total Assessment is a certain percentage of the fair market value that is determined by local assessors to be the total taxable value of land and additions on the property. | Land | Improvement |
|---|---|---|---|---|
| 2025 | $3,030 | $77,400 | $14,812 | $62,588 |
| 2024 | $3,030 | $77,400 | $14,812 | $62,588 |
| 2023 | $3,049 | $77,400 | $14,812 | $62,588 |
| 2022 | $2,504 | $61,316 | $14,812 | $46,504 |
| 2021 | $2,030 | $49,724 | $14,812 | $34,912 |
| 2020 | $2,031 | $49,724 | $14,812 | $34,912 |
| 2019 | $2,037 | $49,724 | $14,812 | $34,912 |
| 2018 | $2,037 | $49,724 | $14,812 | $34,912 |
| 2017 | $1,927 | $46,888 | $14,812 | $32,076 |
| 2016 | $2,600 | $63,027 | $9,600 | $53,427 |
| 2015 | $2,603 | $63,027 | $9,600 | $53,427 |
| 2014 | $2,606 | $63,027 | $9,600 | $53,427 |
| 2013 | -- | $63,027 | $9,600 | $53,427 |
Source: Public Records
Map
Nearby Homes
- 5920 Gleneden Dr
- 2525 Corineth Dr
- 5929 Gleneden Dr
- 2807 Doyle Ave
- 6059 Nassau Cir
- 5906 Forrest Rd
- 2940 Urban Ave
- 2501 White Chapel Dr
- 2672 Honeysuckle Dr
- 6000 Caribou Dr
- 6028 Caribou Dr
- 2505 White Chapel Dr
- 3027 Lansing Ave
- 2249 Mahan Dr
- 5759 Forrest Rd
- 6032 Cordova Rd
- 6213 Fitzgerald Dr
- 2307 Skylake Dr
- 6916 Bradshaw Dr
- 3301 Musket Dr
- 5805 Glenmere Dr
- 5812 Gleneden Dr
- 5823 Glenmere Dr
- 5804 Gleneden Dr
- 5820 Gleneden Dr
- 5799 Glenmere Dr
- 5613 Col Dick McKee Dr
- 5798 Glenmere Dr
- 1817 Cumbaa Ct
- 5796 Gleneden Dr
- 5828 Gleneden Dr
- 5829 Glenmere Dr
- 5793 Glenmere Dr
- 1813 Cumbaa Ct
- 5786 Glenmere Dr
- 5835 Glenmere Dr
- 5619 Col Dick McKee Dr
- 5617 Col Dick McKee Dr
- 5832 Gleneden Dr
- 5813 Gleneden Dr