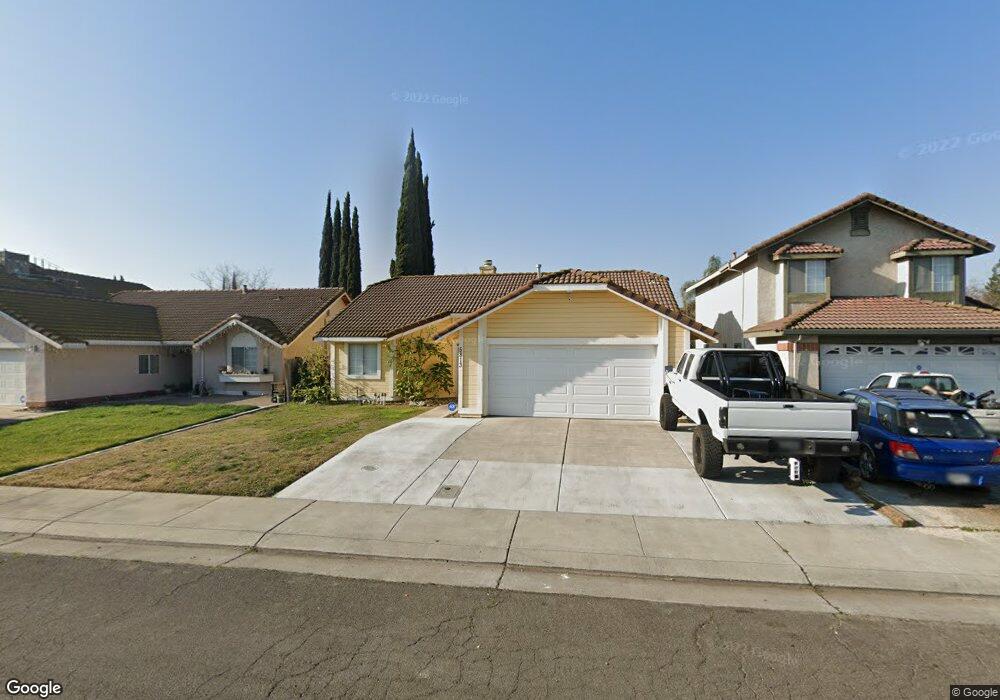
5813 Larcom Ln Stockton, CA 95210
Valley Oak NeighborhoodEstimated Value: $218,000 - $395,000
3
Beds
2
Baths
1,094
Sq Ft
$312/Sq Ft
Est. Value
About This Home
This home is located at 5813 Larcom Ln, Stockton, CA 95210 and is currently estimated at $341,224, approximately $311 per square foot. 5813 Larcom Ln is a home located in San Joaquin County with nearby schools including Rio Calaveras Elementary School, George W. Bush Elementary School, and Valentine Peyton Elementary School.
Ownership History
Date
Name
Owned For
Owner Type
Purchase Details
Closed on
Sep 23, 2009
Sold by
Ramirez Jose and Ramirez Enedina
Bought by
Loeng William
Current Estimated Value
Home Financials for this Owner
Home Financials are based on the most recent Mortgage that was taken out on this home.
Original Mortgage
$85,600
Outstanding Balance
$56,152
Interest Rate
5.25%
Mortgage Type
New Conventional
Estimated Equity
$285,072
Purchase Details
Closed on
Sep 26, 2003
Sold by
Kwan Jimmy M
Bought by
Ramirez Jose and Ramirez Enedina
Home Financials for this Owner
Home Financials are based on the most recent Mortgage that was taken out on this home.
Original Mortgage
$169,600
Interest Rate
6.25%
Mortgage Type
Purchase Money Mortgage
Purchase Details
Closed on
Dec 27, 1993
Sold by
Suares Barry and Suares Nancy
Bought by
Kwan Jimmy M and Chan Pearl
Home Financials for this Owner
Home Financials are based on the most recent Mortgage that was taken out on this home.
Original Mortgage
$57,000
Interest Rate
7.09%
Create a Home Valuation Report for This Property
The Home Valuation Report is an in-depth analysis detailing your home's value as well as a comparison with similar homes in the area
Home Values in the Area
Average Home Value in this Area
Purchase History
| Date | Buyer | Sale Price | Title Company |
|---|---|---|---|
| Loeng William | $107,000 | Chicago Title Company | |
| Ramirez Jose | $212,000 | Chicago Title Co | |
| Kwan Jimmy M | -- | Chicago Title Co | |
| Kwan Jimmy M | $102,000 | Alliance Title Co | |
| Chan Pearl | -- | Alliance Title Co |
Source: Public Records
Mortgage History
| Date | Status | Borrower | Loan Amount |
|---|---|---|---|
| Open | Loeng William | $85,600 | |
| Previous Owner | Ramirez Jose | $169,600 | |
| Previous Owner | Kwan Jimmy M | $57,000 | |
| Closed | Ramirez Jose | $42,400 |
Source: Public Records
Tax History Compared to Growth
Tax History
| Year | Tax Paid | Tax Assessment Tax Assessment Total Assessment is a certain percentage of the fair market value that is determined by local assessors to be the total taxable value of land and additions on the property. | Land | Improvement |
|---|---|---|---|---|
| 2025 | $3,443 | $138,104 | $33,556 | $104,548 |
| 2024 | $3,416 | $135,398 | $32,899 | $102,499 |
| 2023 | $1,648 | $132,744 | $32,254 | $100,490 |
| 2022 | $1,635 | $130,142 | $31,622 | $98,520 |
| 2021 | $1,571 | $127,591 | $31,002 | $96,589 |
| 2020 | $1,602 | $126,284 | $30,685 | $95,599 |
| 2019 | $1,595 | $123,809 | $30,084 | $93,725 |
| 2018 | $1,566 | $121,383 | $29,495 | $91,888 |
| 2017 | $1,484 | $119,004 | $28,917 | $90,087 |
| 2016 | $1,511 | $116,671 | $28,350 | $88,321 |
| 2014 | $1,438 | $112,668 | $27,377 | $85,291 |
Source: Public Records
Map
Nearby Homes
- 2442 Brandywine Ct
- 5831 Caribbean Cir
- 5813 Fred Russo Dr
- 5431 Strawberry Way
- 5816 Caribbean Cir
- 7028 Tristan Cir
- 1864 Caleb Cir
- 5718 Krissi Ct
- 7238 Sharkon Ln
- 1926 Shameran St
- 7112 Tristan Cir
- 2815 Keyser Dr
- 5271 Barbados Cir
- 6130 Fred Russo Dr
- 6706 Tam o Shanter Dr Unit 34
- 6706 Tam o Shanter Dr Unit 45
- 6706 Tam O'Shanter Dr Unit 112
- 6706 Tam o Shanter Dr Unit 61
- 6706 Tam O'Shanter Dr Unit 72
- 6706 Tam o Shanter Dr Unit 126
- 5807 Larcom Ln
- 5819 Larcom Ln
- 2208 Livingston Ln
- 5801 Larcom Ln
- 5726 Atchenson Ct
- 2202 Livingston Ln
- 5810 Larcom Ln
- 5723 Larcom Ln
- 5722 Atchenson Ct
- 5804 Larcom Ln
- 5816 Larcom Ln
- 2128 Livingston Ln
- 5730 Atchenson Ct
- 5717 Larcom Ln
- 5822 Larcom Ln
- 5718 Atchenson Ct
- 2213 Livingston Ln
- 2219 Livingston Ln
- 2207 Livingston Ln
- 2122 Livingston Ln