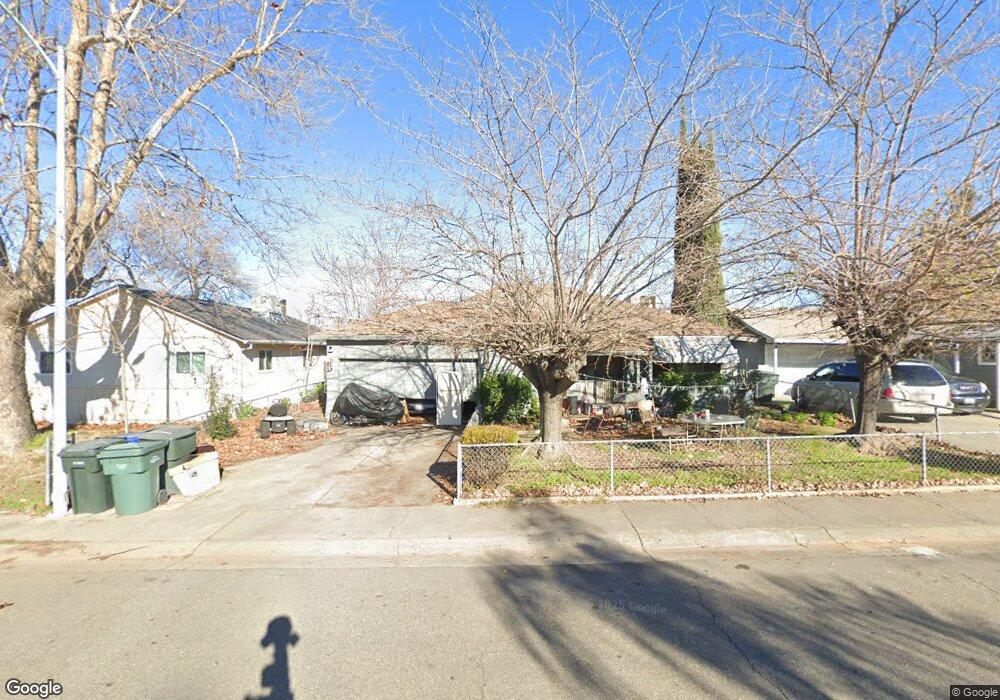
5813 San Ardo Way North Highlands, CA 95660
Estimated Value: $263,000 - $402,497
4
Beds
2
Baths
1,765
Sq Ft
$188/Sq Ft
Est. Value
About This Home
This home is located at 5813 San Ardo Way, North Highlands, CA 95660 and is currently estimated at $331,874, approximately $188 per square foot. 5813 San Ardo Way is a home located in Sacramento County with nearby schools including Kohler Elementary School, Highlands High School, and Community Outreach Academy Elementary School.
Ownership History
Date
Name
Owned For
Owner Type
Purchase Details
Closed on
Nov 10, 2023
Sold by
Lee Linda D D
Bought by
Lee Linda and Wolfe Tralena
Current Estimated Value
Home Financials for this Owner
Home Financials are based on the most recent Mortgage that was taken out on this home.
Original Mortgage
$254,375
Interest Rate
6.79%
Mortgage Type
FHA
Purchase Details
Closed on
Nov 21, 1996
Sold by
Couey Michael and Couey Debra A
Bought by
Lee Linda D D
Home Financials for this Owner
Home Financials are based on the most recent Mortgage that was taken out on this home.
Original Mortgage
$51,687
Interest Rate
7.91%
Mortgage Type
FHA
Purchase Details
Closed on
Jul 11, 1995
Sold by
Couey Debra Ann and Duncan Debra Ann
Bought by
Couey Michael and Couey Debra A
Home Financials for this Owner
Home Financials are based on the most recent Mortgage that was taken out on this home.
Original Mortgage
$11,225
Interest Rate
7.74%
Create a Home Valuation Report for This Property
The Home Valuation Report is an in-depth analysis detailing your home's value as well as a comparison with similar homes in the area
Home Values in the Area
Average Home Value in this Area
Purchase History
| Date | Buyer | Sale Price | Title Company |
|---|---|---|---|
| Lee Linda | $122,500 | None Listed On Document | |
| Lee Linda D D | $51,500 | Chicago Title Co | |
| Couey Michael | -- | Sierra Valley Title Company |
Source: Public Records
Mortgage History
| Date | Status | Borrower | Loan Amount |
|---|---|---|---|
| Previous Owner | Lee Linda | $254,375 | |
| Previous Owner | Lee Linda D D | $51,687 | |
| Previous Owner | Couey Michael | $11,225 |
Source: Public Records
Tax History Compared to Growth
Tax History
| Year | Tax Paid | Tax Assessment Tax Assessment Total Assessment is a certain percentage of the fair market value that is determined by local assessors to be the total taxable value of land and additions on the property. | Land | Improvement |
|---|---|---|---|---|
| 2025 | $1,476 | $136,386 | $40,702 | $95,684 |
| 2024 | $1,476 | $133,712 | $39,904 | $93,808 |
| 2023 | $2,722 | $131,091 | $39,122 | $91,969 |
| 2022 | $1,397 | $128,521 | $38,355 | $90,166 |
| 2021 | $2,810 | $126,002 | $37,603 | $88,399 |
| 2020 | $2,778 | $124,711 | $37,218 | $87,493 |
| 2019 | $2,717 | $122,267 | $36,489 | $85,778 |
| 2018 | $2,844 | $119,871 | $35,774 | $84,097 |
| 2017 | $1,322 | $117,522 | $35,073 | $82,449 |
| 2016 | $2,633 | $115,219 | $34,386 | $80,833 |
| 2015 | $2,504 | $113,489 | $33,870 | $79,619 |
| 2014 | $2,480 | $111,267 | $33,207 | $78,060 |
Source: Public Records
Map
Nearby Homes
- 5832 San Ardo Way
- 6088 Georgia Dr
- 6108 Georgia Dr
- 5705 San Ardo Way
- 3824 Karl Dr
- 5654 Rio Verde Way
- 5708 San Marcos Way
- 5704 San Marcos Way
- 5851 Larry Way
- 6056 Gilman Way
- 3840 San Novado Way
- 4045 Heather Hill Way
- 4321 Palm Ave Unit 98
- 6309 Claussen Way
- 4129 Glascow Dr
- 5606 Hillsdale Blvd Unit B
- 3668 Lowry Dr
- 5508 Hillsdale Blvd
- 6300 Walerga Rd
- 4407 Arrowood Ct
- 5817 San Ardo Way
- 5809 San Ardo Way
- 4032 Karl Dr
- 5821 San Ardo Way
- 4036 Karl Dr
- 5805 San Ardo Way
- 4028 Karl Dr
- 5810 San Ardo Way
- 4040 Karl Dr
- 5816 San Ardo Way
- 4024 Karl Dr
- 5825 San Ardo Way
- 5800 San Ardo Way
- 5820 San Ardo Way
- 5801 San Ardo Way
- 4044 Karl Dr
- 4020 Karl Dr
- 5824 San Ardo Way
- 5829 San Ardo Way
- 4048 Karl Dr