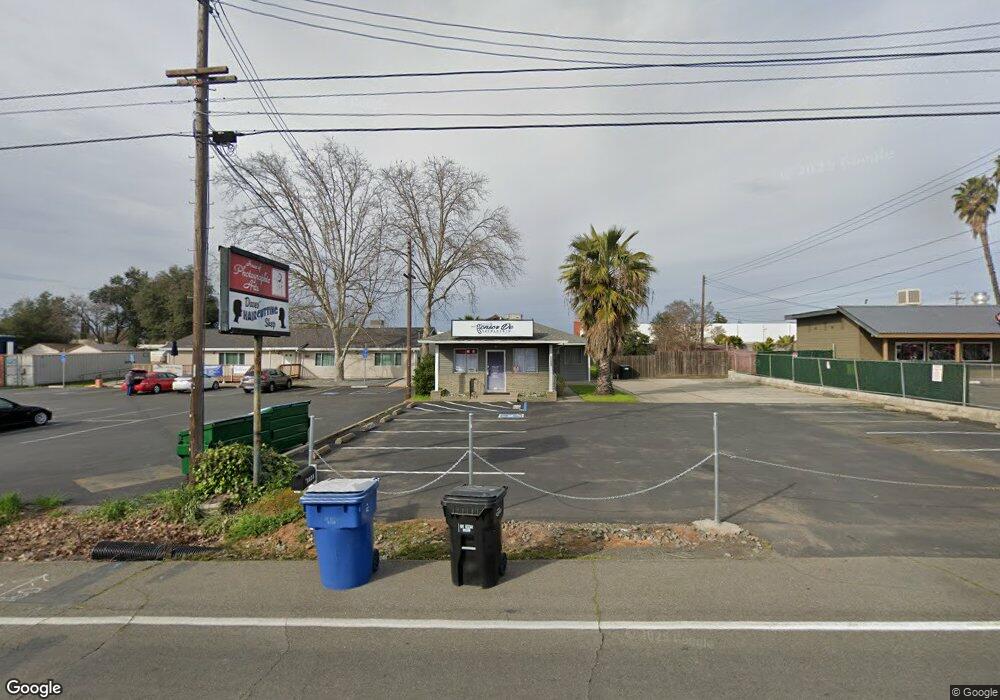
5815 Gibbons Dr Carmichael, CA 95608
Oakvale NeighborhoodEstimated Value: $250,645
2
Beds
1
Bath
2,000
Sq Ft
$125/Sq Ft
Est. Value
About This Home
This home is located at 5815 Gibbons Dr, Carmichael, CA 95608 and is currently estimated at $250,645, approximately $125 per square foot. 5815 Gibbons Dr is a home located in Sacramento County with nearby schools including Cameron Ranch Elementary School, Winston Churchill Middle School, and Mira Loma High School.
Ownership History
Date
Name
Owned For
Owner Type
Purchase Details
Closed on
May 30, 2024
Sold by
Li Xue Qiu
Bought by
Li Living Trust and Li
Current Estimated Value
Purchase Details
Closed on
May 10, 2021
Sold by
Li Li Feng Feng
Bought by
Li Xue Qiu
Purchase Details
Closed on
May 5, 2021
Sold by
Benson Lee and Donald E Benson Personal Trust
Bought by
Li Xue Qiu
Purchase Details
Closed on
Dec 21, 2012
Sold by
Benson Donald E and The Harvena M Reis Living Trus
Bought by
The Donald E Benson Personal Trust
Purchase Details
Closed on
Jun 15, 2007
Sold by
Benson Donald E
Bought by
Harvena M Reis Living Trust
Purchase Details
Closed on
Oct 7, 1994
Sold by
Crawford Norman G and Norman C Crawford Living Trust
Bought by
Benson Donald E
Home Financials for this Owner
Home Financials are based on the most recent Mortgage that was taken out on this home.
Original Mortgage
$132,000
Interest Rate
8.54%
Create a Home Valuation Report for This Property
The Home Valuation Report is an in-depth analysis detailing your home's value as well as a comparison with similar homes in the area
Home Values in the Area
Average Home Value in this Area
Purchase History
| Date | Buyer | Sale Price | Title Company |
|---|---|---|---|
| Li Living Trust | -- | None Listed On Document | |
| Li Xue Qiu | -- | Chicago Title Company | |
| Li Xue Qiu | $236,000 | Chicago Title Company | |
| The Donald E Benson Personal Trust | -- | None Available | |
| Harvena M Reis Living Trust | -- | None Available | |
| Benson Donald E | $141,500 | North American Title Company |
Source: Public Records
Mortgage History
| Date | Status | Borrower | Loan Amount |
|---|---|---|---|
| Previous Owner | Benson Donald E | $132,000 |
Source: Public Records
Tax History
| Year | Tax Paid | Tax Assessment Tax Assessment Total Assessment is a certain percentage of the fair market value that is determined by local assessors to be the total taxable value of land and additions on the property. | Land | Improvement |
|---|---|---|---|---|
| 2025 | $3,344 | $255,450 | $107,159 | $148,291 |
| 2024 | $3,344 | $250,442 | $105,058 | $145,384 |
| 2023 | $3,258 | $245,533 | $102,999 | $142,534 |
| 2022 | $3,231 | $240,720 | $100,980 | $139,740 |
| 2021 | $2,973 | $219,551 | $93,093 | $126,458 |
| 2020 | $2,895 | $217,301 | $92,139 | $125,162 |
| 2019 | $2,834 | $213,041 | $90,333 | $122,708 |
| 2018 | $2,795 | $208,864 | $88,562 | $120,302 |
| 2017 | $2,762 | $204,770 | $86,826 | $117,944 |
| 2016 | $2,342 | $200,756 | $85,124 | $115,632 |
| 2015 | $2,309 | $197,742 | $83,846 | $113,896 |
| 2014 | $2,260 | $193,869 | $82,204 | $111,665 |
Source: Public Records
Map
Nearby Homes
- 3905 Apple Blossom Way
- 6008 Amir Ln
- 5622 Cypress Ave
- 5531 Cypress Ave
- 7032 Fair Oaks Blvd Unit 5
- 7032 Fair Oaks Blvd Unit 1
- 5443 Aris Way
- 4132 Empire Way
- 3538 Tarro Way
- 3543 Tarro Way
- 6141 Lincoln Ave
- 5500 Whitfield Way
- 5812 Kimberly Hill Ct
- 5412 Wildflower Cir
- 6130 Sizemore Ln
- 5307 Nyoda Way
- 6420 Quiescence Ln Unit C
- 4448 Hackberry Ln
- 3900 Park Circle Ln Unit B
- 4007 Oak Villa Cir
- 7411 Fair Oaks Blvd
- 5825 Gibbons Dr
- 5848 Gibbons Dr
- 5745 Gibbons Dr
- 7423 Fair Oaks Blvd Unit 7
- 5824 Gibbons Dr
- 5731 Gibbons Dr
- 5812 Gibbons Dr
- 5806 Gibbons Dr
- 5808 Gibbons Dr
- 5800 Gibbons Dr
- 3906 Apple Blossom Way
- 3910 Apple Blossom Way
- 5713 Gibbons Dr
- 5810 Gibbons Dr
- 7429 Fair Oaks Blvd
- 5843 Sutter Ave
- 7336 Fair Oaks Blvd
- 5833 Sutter Ave
- 3912 Apple Blossom Way
Your Personal Tour Guide
Ask me questions while you tour the home.