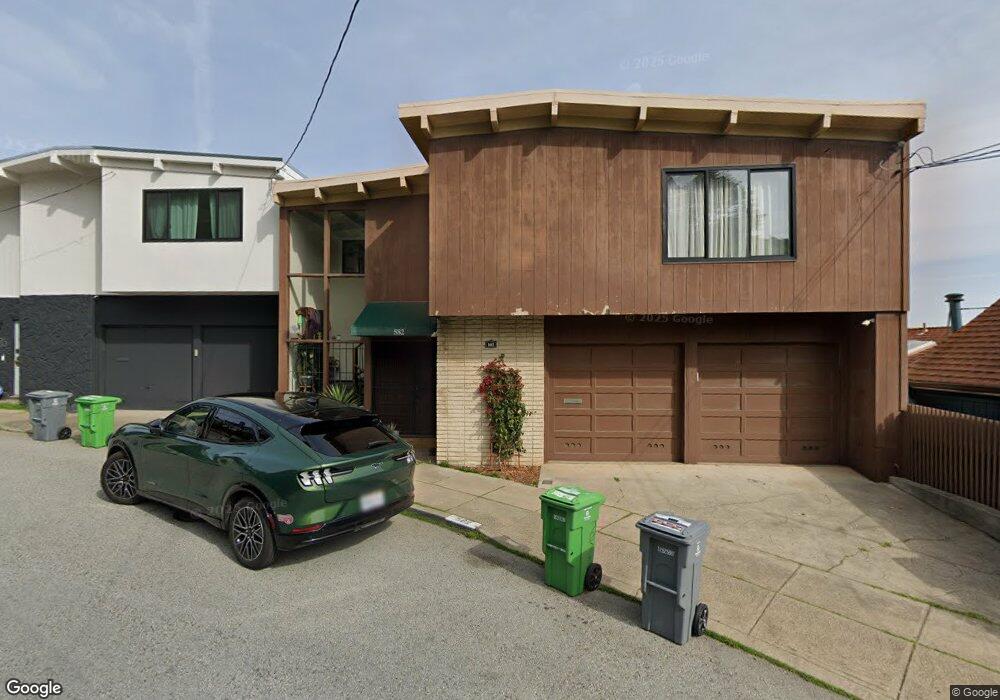
582 30th St San Francisco, CA 94131
Noe Valley NeighborhoodEstimated Value: $2,560,847 - $2,714,000
2
Beds
2
Baths
1,961
Sq Ft
$1,357/Sq Ft
Est. Value
About This Home
This home is located at 582 30th St, San Francisco, CA 94131 and is currently estimated at $2,660,212, approximately $1,356 per square foot. 582 30th St is a home located in San Francisco County with nearby schools including Glen Park Elementary School, James Lick Middle School, and St. Philip School.
Ownership History
Date
Name
Owned For
Owner Type
Purchase Details
Closed on
Mar 8, 2023
Sold by
Patricia L Holt Revocable Trust
Bought by
Koral Eli Henry Z and Lebeau Ruth Edo
Current Estimated Value
Purchase Details
Closed on
May 7, 2009
Sold by
Holt Patricia L
Bought by
Holt Patricia L
Purchase Details
Closed on
Jul 3, 2007
Sold by
Ogus Irene
Bought by
Holt Patricia L
Purchase Details
Closed on
Aug 16, 2005
Sold by
Holt Patricia L and Ryan Terry E
Bought by
Holt Patricia L and Ryan Terry E
Purchase Details
Closed on
Dec 30, 2004
Sold by
Ryan Terry E
Bought by
Ryan Terry E
Create a Home Valuation Report for This Property
The Home Valuation Report is an in-depth analysis detailing your home's value as well as a comparison with similar homes in the area
Home Values in the Area
Average Home Value in this Area
Purchase History
| Date | Buyer | Sale Price | Title Company |
|---|---|---|---|
| Koral Eli Henry Z | -- | Old Republic Title | |
| Koral Eli Henry Z | $583,500 | Old Republic Title | |
| Holt Patricia L | -- | None Available | |
| Holt Patricia L | -- | None Available | |
| Holt Patricia L | -- | -- | |
| Ryan Terry E | -- | -- |
Source: Public Records
Tax History Compared to Growth
Tax History
| Year | Tax Paid | Tax Assessment Tax Assessment Total Assessment is a certain percentage of the fair market value that is determined by local assessors to be the total taxable value of land and additions on the property. | Land | Improvement |
|---|---|---|---|---|
| 2025 | $28,669 | $2,427,594 | $1,699,317 | $728,277 |
| 2024 | $28,669 | $2,379,996 | $1,665,998 | $713,998 |
| 2023 | $6,804 | $519,722 | $150,073 | $369,649 |
| 2022 | $6,661 | $509,534 | $147,132 | $362,402 |
| 2021 | $6,538 | $499,545 | $144,248 | $355,297 |
| 2020 | $6,582 | $494,425 | $142,770 | $351,655 |
| 2019 | $6,358 | $484,733 | $139,972 | $344,761 |
| 2018 | $6,144 | $475,191 | $137,219 | $337,972 |
| 2017 | $5,771 | $465,876 | $134,530 | $331,346 |
| 2016 | $5,655 | $456,743 | $131,893 | $324,850 |
| 2015 | $5,583 | $449,884 | $129,913 | $319,971 |
| 2014 | $5,436 | $441,073 | $127,369 | $313,704 |
Source: Public Records
Map
Nearby Homes