Estimated Value: $324,000 - $367,000
5
Beds
3
Baths
2,938
Sq Ft
$118/Sq Ft
Est. Value
About This Home
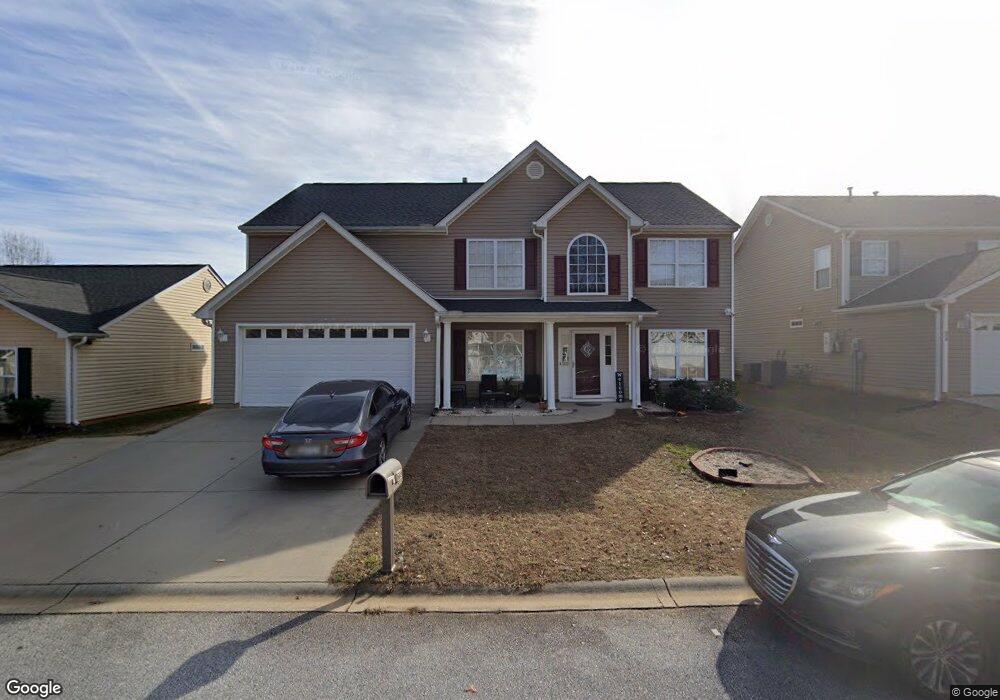
This home is located at 582 Hamilton Chase Dr, Moore, SC 29369 and is currently estimated at $347,002, approximately $118 per square foot. 582 Hamilton Chase Dr is a home located in Spartanburg County with nearby schools including Dorman High School Freshman Campus, Dorman High School, and GREEN Charter School Spartanburg.
Ownership History
Date
Name
Owned For
Owner Type
Purchase Details
Closed on
Jan 15, 2025
Sold by
Palmetto Rentals Llc
Bought by
Gordon Shonia Delisa and Gordon Edward Zaman
Current Estimated Value
Purchase Details
Closed on
Mar 6, 2020
Sold by
Palmetto Rentals Llc
Bought by
Gordon Shonia Delisa and Gordon Edward Zaman
Home Financials for this Owner
Home Financials are based on the most recent Mortgage that was taken out on this home.
Original Mortgage
$179,900
Interest Rate
3.2%
Mortgage Type
Land Contract Argmt. Of Sale
Purchase Details
Closed on
Sep 23, 2019
Sold by
Bretz Carl W and Bretz Robbi J
Bought by
Palmetto Rentals Llc
Purchase Details
Closed on
May 7, 2012
Sold by
Bretz Robbi J
Bought by
Bretz Ii Carl W
Purchase Details
Closed on
Jul 20, 2004
Sold by
Lennar Carolina Inc
Bought by
Bretz Carl W and Bretz Robbi J
Create a Home Valuation Report for This Property
The Home Valuation Report is an in-depth analysis detailing your home's value as well as a comparison with similar homes in the area
Home Values in the Area
Average Home Value in this Area
Purchase History
| Date | Buyer | Sale Price | Title Company |
|---|---|---|---|
| Gordon Shonia Delisa | -- | Ideal Title | |
| Gordon Shonia Delisa | -- | Ideal Title | |
| Gordon Shonia Delisa | $244,900 | None Available | |
| Palmetto Rentals Llc | $171,000 | None Available | |
| Bretz Ii Carl W | -- | -- | |
| Bretz Carl W | $147,168 | -- |
Source: Public Records
Mortgage History
| Date | Status | Borrower | Loan Amount |
|---|---|---|---|
| Previous Owner | Gordon Shonia Delisa | $179,900 |
Source: Public Records
Tax History Compared to Growth
Tax History
| Year | Tax Paid | Tax Assessment Tax Assessment Total Assessment is a certain percentage of the fair market value that is determined by local assessors to be the total taxable value of land and additions on the property. | Land | Improvement |
|---|---|---|---|---|
| 2025 | $1,557 | $9,253 | $772 | $8,481 |
| 2024 | $1,557 | $9,253 | $772 | $8,481 |
| 2023 | $1,557 | $9,253 | $772 | $8,481 |
Source: Public Records
Map
Nearby Homes
- 283 Weston Valley Dr
- 659 Markham Cir
- 754 Markham Cir
- 105 Pimmit Run
- 105 Pimmitt Run
- 1732 Constitution Ln
- 1824 Betsy Ross Dr
- 1820 Betsy Ross Dr
- Cypress Plan at Founders Club
- Davidson Plan at Founders Club
- Raleigh Plan at Founders Club
- Wescott Plan at Founders Club
- Avery Plan at Founders Club
- McDowell Plan at Founders Club
- 1728 Constitution Ln
- 1724 Constitution Ln
- 1825 Betsy Ross Dr
- 1817 Betsy Ross Dr
- 1720 Constitution Ln
- 1821 Betsy Ross Dr
- 586 Hamilton Chase Dr
- 578 Hamilton Chase Dr
- 291 Weston Valley Dr
- 295 Weston Valley Dr
- 289 Weston Valley Dr
- 590 Hamilton Chase Dr
- 297 Weston Valley Dr
- 574 Hamilton Chase Dr
- 287 Weston Valley Dr
- 299 Weston Valley Dr
- 583 Hamilton Chase Dr
- 303 Weston Valley Dr
- 587 Hamilton Chase Dr
- 579 Hamilton Chase Dr
- 570 Hamilton Chase Dr
- 281 Weston Valley Dr Unit B
- 305 Weston Valley Dr
- 594 Hamilton Chase Dr
- 575 Hamilton Chase Dr
- 591 Hamilton Chase Dr