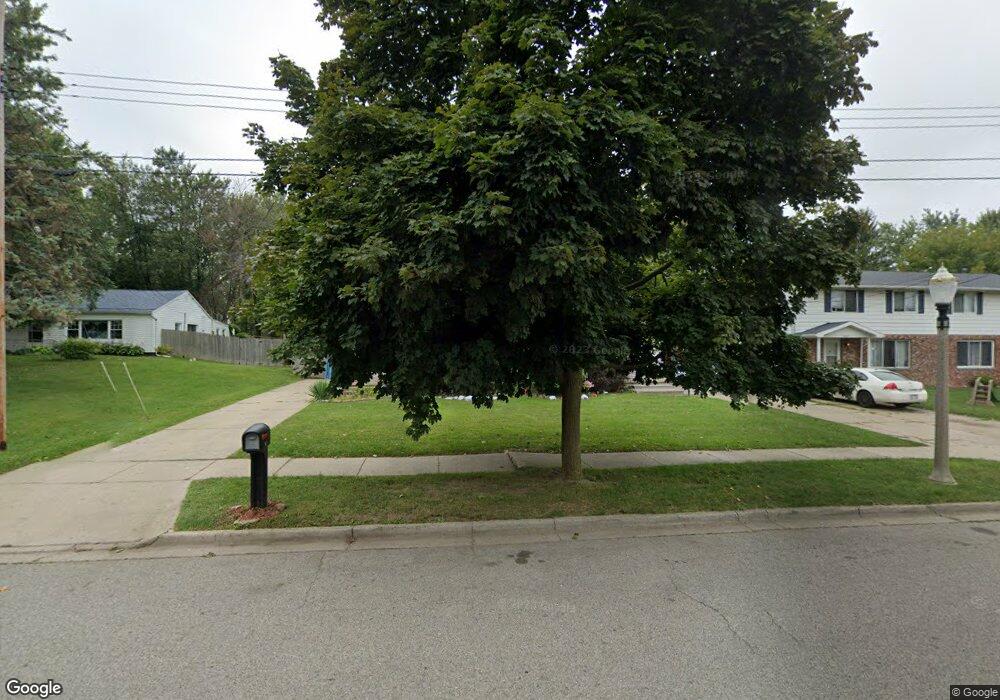
5826 Orchard Ct Lansing, MI 48911
Southern Lansing NeighborhoodEstimated Value: $155,175 - $250,000
2
Beds
1
Bath
2,496
Sq Ft
$86/Sq Ft
Est. Value
About This Home
This home is located at 5826 Orchard Ct, Lansing, MI 48911 and is currently estimated at $213,544, approximately $85 per square foot. 5826 Orchard Ct is a home located in Ingham County with nearby schools including Kendon School, Attwood School, and Everett High School.
Ownership History
Date
Name
Owned For
Owner Type
Purchase Details
Closed on
Jul 1, 2006
Sold by
Sermak Daniel M
Bought by
Dms Litd Llc
Current Estimated Value
Home Financials for this Owner
Home Financials are based on the most recent Mortgage that was taken out on this home.
Original Mortgage
$162,500
Interest Rate
6.68%
Mortgage Type
Purchase Money Mortgage
Purchase Details
Closed on
Jun 12, 2006
Sold by
Dms Ltd Llc
Bought by
Sermak Daniel M
Home Financials for this Owner
Home Financials are based on the most recent Mortgage that was taken out on this home.
Original Mortgage
$162,500
Interest Rate
6.68%
Mortgage Type
Purchase Money Mortgage
Purchase Details
Closed on
Dec 9, 2004
Sold by
Sermak Daniel
Bought by
Dms Ltd Llc
Purchase Details
Closed on
Jul 16, 2004
Sold by
Lowrie Charlene L and Lowrie Brian M
Bought by
Sermak Daniel
Home Financials for this Owner
Home Financials are based on the most recent Mortgage that was taken out on this home.
Original Mortgage
$157,700
Interest Rate
7.85%
Mortgage Type
Purchase Money Mortgage
Create a Home Valuation Report for This Property
The Home Valuation Report is an in-depth analysis detailing your home's value as well as a comparison with similar homes in the area
Home Values in the Area
Average Home Value in this Area
Purchase History
| Date | Buyer | Sale Price | Title Company |
|---|---|---|---|
| Dms Litd Llc | -- | Capitol City Title Agency | |
| Sermak Daniel M | -- | Capitol City Title Agency | |
| Dms Ltd Llc | -- | -- | |
| Sermak Daniel | $166,000 | Transnation Title |
Source: Public Records
Mortgage History
| Date | Status | Borrower | Loan Amount |
|---|---|---|---|
| Previous Owner | Sermak Daniel M | $162,500 | |
| Previous Owner | Sermak Daniel | $157,700 |
Source: Public Records
Tax History
| Year | Tax Paid | Tax Assessment Tax Assessment Total Assessment is a certain percentage of the fair market value that is determined by local assessors to be the total taxable value of land and additions on the property. | Land | Improvement |
|---|---|---|---|---|
| 2025 | $3,833 | $78,300 | $12,200 | $66,100 |
| 2024 | $30 | $78,900 | $12,200 | $66,700 |
| 2023 | $3,540 | $72,700 | $12,200 | $60,500 |
| 2022 | $3,238 | $53,200 | $11,200 | $42,000 |
| 2021 | $3,163 | $49,200 | $10,600 | $38,600 |
| 2020 | $3,140 | $47,300 | $10,600 | $36,700 |
| 2019 | $3,029 | $41,900 | $10,600 | $31,300 |
| 2018 | $2,876 | $40,900 | $10,600 | $30,300 |
| 2017 | $2,767 | $40,900 | $10,600 | $30,300 |
| 2016 | $2,657 | $38,200 | $10,600 | $27,600 |
| 2015 | $2,657 | $38,300 | $21,144 | $17,156 |
| 2014 | $2,657 | $34,300 | $26,024 | $8,276 |
Source: Public Records
Map
Nearby Homes
- 115 E Claremore Dr
- 208 E Northrup St
- 6246 Gardenia Ave
- 125 E Northrup St
- 6264 Beechfield Dr Unit 97
- 6300 Beechfield Dr Unit 87
- 6321 Beechfield Dr Unit 37
- 6317 Beechfield Dr Unit 49
- 6331 Beechfield Dr Unit 42
- 1109 Barr Ave
- 6341 Beechfield Dr Unit 53
- 5008 Southgate Ave
- 6137 Scotmar Dr Unit 19
- 6129 Scotmar Dr Unit 15
- 6429 Rosedale Rd
- 6422 Lerner Way
- 205 E Jolly Rd Unit 6
- 1265 Roth Dr
- 6253 Hilliard Rd
- 4719 S Pennsylvania Ave
Your Personal Tour Guide
Ask me questions while you tour the home.