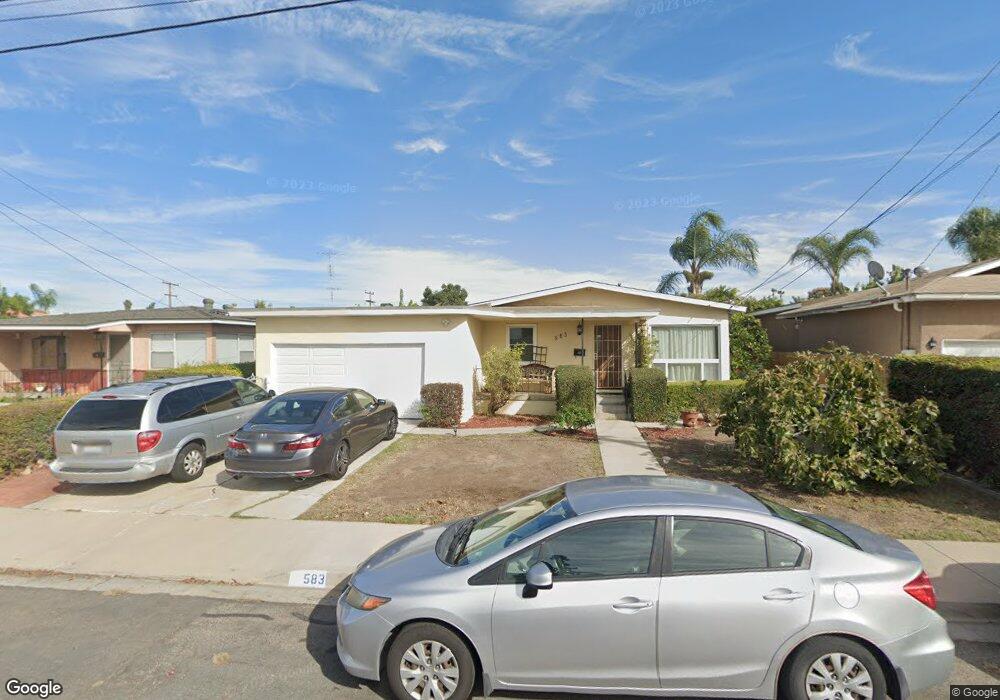
583 Fig Ave Chula Vista, CA 91910
Downtown Chula Vista NeighborhoodEstimated Value: $769,637 - $838,000
3
Beds
2
Baths
1,600
Sq Ft
$508/Sq Ft
Est. Value
About This Home
This home is located at 583 Fig Ave, Chula Vista, CA 91910 and is currently estimated at $813,159, approximately $508 per square foot. 583 Fig Ave is a home located in San Diego County with nearby schools including Vista Square Elementary School, Chula Vista Middle School, and Chula Vista High School.
Ownership History
Date
Name
Owned For
Owner Type
Purchase Details
Closed on
Jul 16, 2001
Sold by
Relph John Kermit and Relph Joyce
Bought by
Castorena Xalick and Western Clarissa
Current Estimated Value
Home Financials for this Owner
Home Financials are based on the most recent Mortgage that was taken out on this home.
Original Mortgage
$206,400
Outstanding Balance
$79,252
Interest Rate
7.09%
Estimated Equity
$733,907
Create a Home Valuation Report for This Property
The Home Valuation Report is an in-depth analysis detailing your home's value as well as a comparison with similar homes in the area
Home Values in the Area
Average Home Value in this Area
Purchase History
| Date | Buyer | Sale Price | Title Company |
|---|---|---|---|
| Castorena Xalick | $258,000 | First American Title Ins Co |
Source: Public Records
Mortgage History
| Date | Status | Borrower | Loan Amount |
|---|---|---|---|
| Open | Castorena Xalick | $206,400 | |
| Closed | Castorena Xalick | $38,700 |
Source: Public Records
Tax History
| Year | Tax Paid | Tax Assessment Tax Assessment Total Assessment is a certain percentage of the fair market value that is determined by local assessors to be the total taxable value of land and additions on the property. | Land | Improvement |
|---|---|---|---|---|
| 2025 | $4,320 | $381,123 | $147,720 | $233,403 |
| 2024 | $4,320 | $373,651 | $144,824 | $228,827 |
| 2023 | $4,259 | $366,326 | $141,985 | $224,341 |
| 2022 | $4,135 | $359,144 | $139,201 | $219,943 |
| 2021 | $4,039 | $352,103 | $136,472 | $215,631 |
| 2020 | $3,941 | $348,493 | $135,073 | $213,420 |
| 2019 | $3,838 | $341,661 | $132,425 | $209,236 |
| 2018 | $3,778 | $334,963 | $129,829 | $205,134 |
| 2017 | $10 | $328,396 | $127,284 | $201,112 |
| 2016 | $3,610 | $321,958 | $124,789 | $197,169 |
| 2015 | $3,557 | $317,123 | $122,915 | $194,208 |
| 2014 | $3,497 | $310,912 | $120,508 | $190,404 |
Source: Public Records
Map
Nearby Homes
- 515 Avenida Centro Unit 101
- 520 Glover Ave
- 490 Fourth Ave Unit 32
- 490 Fourth Ave Unit 21
- 471 4th Ave
- 475 4th Ave Unit H
- 471 4th Ave Unit B
- 644 Beech Ave
- 709 Brightwood Ave
- 689 Garrett Ave
- 732 Brightwood Ave
- 617 3rd Ave Unit 14
- 618-20 Whitney St
- 736 Date Ave
- 536 Park Way Unit 41,42
- 633 Del Mar Ave
- 630 1/2 J St
- 376 Center St Unit 304
- 376 Center St Unit 220
- 709 Madison Ave
Your Personal Tour Guide
Ask me questions while you tour the home.