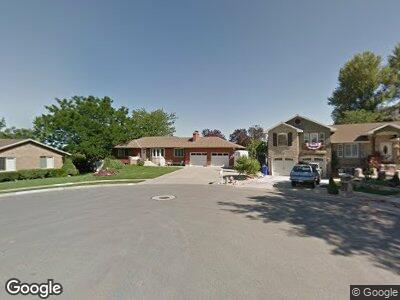
583 N 180 E Centerville, UT 84014
Estimated Value: $662,000 - $732,000
5
Beds
4
Baths
1,883
Sq Ft
$370/Sq Ft
Est. Value
About This Home
This home is located at 583 N 180 E, Centerville, UT 84014 and is currently estimated at $696,412, approximately $369 per square foot. 583 N 180 E is a home located in Davis County with nearby schools including Centerville Elementary, Centerville Jr High, and Viewmont High School.
Ownership History
Date
Name
Owned For
Owner Type
Purchase Details
Closed on
Sep 9, 2019
Sold by
Ogzewalla Roger L and Ogzewalla Peggy D
Bought by
Ogzewalla Peggy and Ogzewalla Roger Layne
Current Estimated Value
Home Financials for this Owner
Home Financials are based on the most recent Mortgage that was taken out on this home.
Original Mortgage
$200,000
Interest Rate
3.7%
Mortgage Type
New Conventional
Purchase Details
Closed on
Jan 28, 2005
Sold by
Newby Anthony W
Bought by
Newby Anthony W
Home Financials for this Owner
Home Financials are based on the most recent Mortgage that was taken out on this home.
Original Mortgage
$194,250
Interest Rate
5.8%
Mortgage Type
New Conventional
Purchase Details
Closed on
Apr 22, 2002
Sold by
Fraughton Cody D and Fraughton Charli
Bought by
Ogzewalla Roger L and Ogzewalla Peggy D
Home Financials for this Owner
Home Financials are based on the most recent Mortgage that was taken out on this home.
Original Mortgage
$193,800
Interest Rate
6.87%
Create a Home Valuation Report for This Property
The Home Valuation Report is an in-depth analysis detailing your home's value as well as a comparison with similar homes in the area
Home Values in the Area
Average Home Value in this Area
Purchase History
| Date | Buyer | Sale Price | Title Company |
|---|---|---|---|
| Ogzewalla Peggy | -- | Cache Title Company | |
| Ogzewalla Roger L | -- | Security Title Company |
Source: Public Records
Mortgage History
| Date | Status | Borrower | Loan Amount |
|---|---|---|---|
| Open | Ogzewalla Peggy | $400,000 | |
| Closed | Ogzewalla Peggy | $200,125 | |
| Closed | Ogzewalla Peggy | $200,000 | |
| Closed | Ogzewalla Roger L | $80,000 | |
| Closed | Ogzewalla Roger L | $233,500 | |
| Closed | Ogzewalla Roger L | $75,000 | |
| Closed | Ogzewalla Peggy D | $40,000 | |
| Closed | Ogzewalla Roger L | $194,250 | |
| Closed | Ogzewalla Roger L | $193,800 |
Source: Public Records
Tax History Compared to Growth
Tax History
| Year | Tax Paid | Tax Assessment Tax Assessment Total Assessment is a certain percentage of the fair market value that is determined by local assessors to be the total taxable value of land and additions on the property. | Land | Improvement |
|---|---|---|---|---|
| 2024 | $3,590 | $349,250 | $154,858 | $194,392 |
| 2023 | $3,396 | $597,000 | $253,827 | $343,173 |
| 2022 | $3,608 | $349,250 | $128,207 | $221,043 |
| 2021 | $3,157 | $476,000 | $195,837 | $280,163 |
| 2020 | $3,104 | $468,000 | $191,225 | $276,775 |
| 2019 | $3,124 | $460,000 | $191,515 | $268,485 |
| 2018 | $2,874 | $418,000 | $177,700 | $240,300 |
| 2016 | $2,551 | $206,250 | $59,679 | $146,571 |
| 2015 | $2,512 | $191,565 | $59,679 | $131,886 |
| 2014 | $2,867 | $177,100 | $59,679 | $117,421 |
| 2013 | -- | $159,359 | $48,624 | $110,735 |
Source: Public Records
Map
Nearby Homes
- 67 E 400 N
- 77 W 550 N
- 871 Bonita Way Unit 19
- 105 W Pheasantbrook Dr
- 851 Pheasantbrook Cir
- 81 Pheasantbrook Dr
- 282 W 605 N Unit 307
- 584 Aspen Way
- 128 Pheasantbrook Dr
- 940 N 400 E
- 272 W 680 N
- 290 W 650 N
- 203 W Pheasantbrook Dr
- 147 W 925 N
- 1012 N 250 E
- 225 W 925 N
- 88 W 50 S Unit V-1
- 88 W 50 S Unit A11
- 88 W 50 S Unit Q6
- 88 W 50 S Unit C11