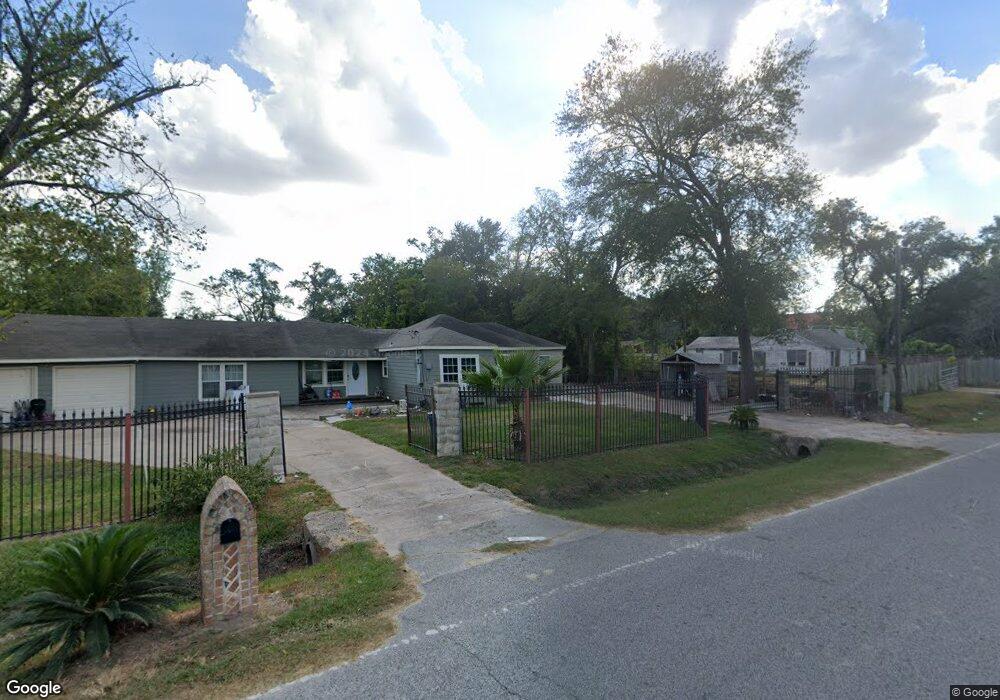
5831 Spindle Dr Houston, TX 77086
Recreation Farms NeighborhoodEstimated Value: $440,577 - $714,000
4
Beds
3
Baths
1,700
Sq Ft
$318/Sq Ft
Est. Value
About This Home
This home is located at 5831 Spindle Dr, Houston, TX 77086 and is currently estimated at $540,144, approximately $317 per square foot. 5831 Spindle Dr is a home located in Harris County with nearby schools including Eiland Elementary School, Klein Intermediate School, and Klein Forest High School.
Ownership History
Date
Name
Owned For
Owner Type
Purchase Details
Closed on
Mar 21, 2005
Sold by
Jp Morgan Chase Bank
Bought by
Martinez Leticia
Current Estimated Value
Home Financials for this Owner
Home Financials are based on the most recent Mortgage that was taken out on this home.
Original Mortgage
$109,150
Outstanding Balance
$66,715
Interest Rate
8.87%
Mortgage Type
Purchase Money Mortgage
Estimated Equity
$473,429
Purchase Details
Closed on
Nov 2, 2004
Sold by
Herrera Cesar and Martinez Sujey
Bought by
Jpmorgan Chase Bank
Purchase Details
Closed on
Jun 27, 2003
Sold by
Mondragon Rogaciano
Bought by
Herrera Cesar and Martinez Sujey
Home Financials for this Owner
Home Financials are based on the most recent Mortgage that was taken out on this home.
Original Mortgage
$117,320
Interest Rate
5.27%
Mortgage Type
Purchase Money Mortgage
Purchase Details
Closed on
Oct 14, 2002
Sold by
Roese Frances Mozelle Armstrong
Bought by
Mondragon Rogaciano
Create a Home Valuation Report for This Property
The Home Valuation Report is an in-depth analysis detailing your home's value as well as a comparison with similar homes in the area
Home Values in the Area
Average Home Value in this Area
Purchase History
| Date | Buyer | Sale Price | Title Company |
|---|---|---|---|
| Martinez Leticia | -- | Allegiance Title Company | |
| Jpmorgan Chase Bank | $89,250 | -- | |
| Herrera Cesar | -- | Fidelity National Title | |
| Mondragon Rogaciano | -- | Chicago Title |
Source: Public Records
Mortgage History
| Date | Status | Borrower | Loan Amount |
|---|---|---|---|
| Open | Martinez Leticia | $109,150 | |
| Previous Owner | Herrera Cesar | $117,320 |
Source: Public Records
Tax History Compared to Growth
Tax History
| Year | Tax Paid | Tax Assessment Tax Assessment Total Assessment is a certain percentage of the fair market value that is determined by local assessors to be the total taxable value of land and additions on the property. | Land | Improvement |
|---|---|---|---|---|
| 2025 | $2,346 | $459,168 | $381,132 | $78,036 |
| 2024 | $2,346 | $460,055 | $381,132 | $78,923 |
| 2023 | $2,346 | $335,051 | $254,088 | $80,963 |
| 2022 | $3,214 | $308,330 | $232,914 | $75,416 |
| 2021 | $3,098 | $145,414 | $84,696 | $60,718 |
| 2020 | $2,940 | $128,674 | $63,522 | $65,152 |
| 2019 | $3,053 | $128,674 | $63,522 | $65,152 |
| 2018 | $1,483 | $128,674 | $63,522 | $65,152 |
| 2017 | $3,053 | $128,674 | $63,522 | $65,152 |
| 2016 | $3,053 | $128,674 | $63,522 | $65,152 |
| 2015 | $2,484 | $122,252 | $63,522 | $58,730 |
| 2014 | $2,484 | $122,252 | $63,522 | $58,730 |
Source: Public Records
Map
Nearby Homes
- 5721 Breen Dr
- 5626 Spindle Dr
- 6011 Killough St
- 5930 Killough St
- 6222 Downwood Forest Dr
- 5638 Fairview Forest Dr
- 5718 Longforest Dr
- 5831 Longforest Dr
- 5233 Breen Dr
- 5523 Fair Forest Dr
- 8810 Enchanted Forest Dr
- 8918 Bold Forest Dr
- 00 Romona Blvd
- 10809 W Montgomery Rd
- 5406 Fairview Forest Dr
- 6713 Breen Dr
- 11727 State Highway 249
- 6006 Ogden Forest Dr
- 6902 Breen Dr
- 6111 Ogden Forest Dr
- 5907 Spindle Dr
- 5919 Spindle Dr
- 5806 Spindle Dr
- 5902 Spindle Dr
- 5908 Spindle Dr
- 5720 Spindle Dr
- 0 Spindle Dr
- 5802 Spindle Dr
- 5810 Breen Dr
- 5923 Spindle Dr
- 5715 Spindle Dr
- 5924 Spindle Dr
- 5716 Spindle Dr
- 5804 Breen Dr
- 5910 Breen Dr
- 6002 Spindle Dr
- 5916 Breen Dr
- 11721 Zuinn St
- 5729 Killough St
- 6007 Spindle Dr