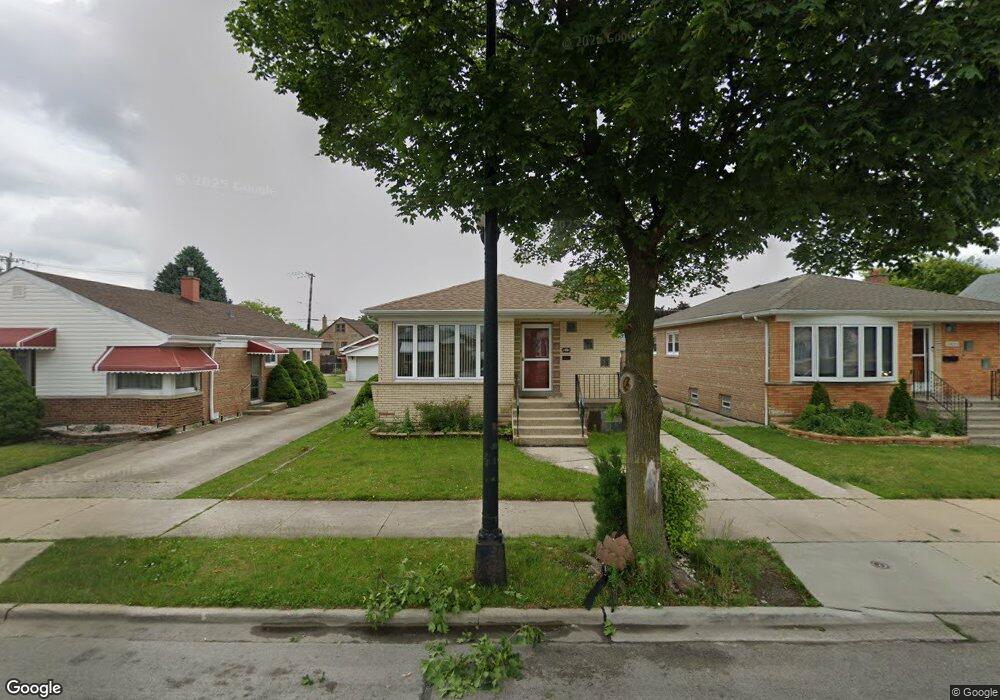
5835 S Austin Ave Chicago, IL 60638
Garfield Ridge NeighborhoodEstimated Value: $302,000 - $364,000
3
Beds
1
Bath
1,059
Sq Ft
$324/Sq Ft
Est. Value
About This Home
This home is located at 5835 S Austin Ave, Chicago, IL 60638 and is currently estimated at $342,855, approximately $323 per square foot. 5835 S Austin Ave is a home located in Cook County with nearby schools including Kinzie Elementary School, Kennedy High School, and St. Symphorosa Catholic School.
Ownership History
Date
Name
Owned For
Owner Type
Purchase Details
Closed on
Sep 21, 2010
Sold by
Federal National Mortgage Association
Bought by
Martinez Sandra
Current Estimated Value
Home Financials for this Owner
Home Financials are based on the most recent Mortgage that was taken out on this home.
Original Mortgage
$160,949
Outstanding Balance
$106,172
Interest Rate
4.42%
Mortgage Type
FHA
Estimated Equity
$236,683
Purchase Details
Closed on
May 5, 2010
Sold by
Mrowca Mieczyslaw
Bought by
Federal National Mortgage Association
Purchase Details
Closed on
Jul 20, 2005
Sold by
Studzinski Stephen P
Bought by
Mrowca Mieczyslaw
Home Financials for this Owner
Home Financials are based on the most recent Mortgage that was taken out on this home.
Original Mortgage
$204,000
Interest Rate
5.74%
Mortgage Type
Fannie Mae Freddie Mac
Purchase Details
Closed on
Nov 15, 2004
Sold by
Studzinski Stephen Paul and Studzinski Peggy Jean
Bought by
Studzinski Stephen Paul and Studzinski Peggy Jean
Create a Home Valuation Report for This Property
The Home Valuation Report is an in-depth analysis detailing your home's value as well as a comparison with similar homes in the area
Home Values in the Area
Average Home Value in this Area
Purchase History
| Date | Buyer | Sale Price | Title Company |
|---|---|---|---|
| Martinez Sandra | $145,000 | Attorneys Title Guaranty Fun | |
| Federal National Mortgage Association | -- | None Available | |
| Mrowca Mieczyslaw | $255,000 | Chicago Title Insurance Comp | |
| Studzinski Stephen Paul | -- | -- |
Source: Public Records
Mortgage History
| Date | Status | Borrower | Loan Amount |
|---|---|---|---|
| Open | Martinez Sandra | $160,949 | |
| Previous Owner | Mrowca Mieczyslaw | $204,000 |
Source: Public Records
Tax History Compared to Growth
Tax History
| Year | Tax Paid | Tax Assessment Tax Assessment Total Assessment is a certain percentage of the fair market value that is determined by local assessors to be the total taxable value of land and additions on the property. | Land | Improvement |
|---|---|---|---|---|
| 2024 | $4,176 | $28,000 | $6,562 | $21,438 |
| 2023 | $4,050 | $23,000 | $5,859 | $17,141 |
| 2022 | $4,050 | $23,000 | $5,859 | $17,141 |
| 2021 | $3,955 | $22,999 | $5,858 | $17,141 |
| 2020 | $3,684 | $19,534 | $4,687 | $14,847 |
| 2019 | $3,695 | $21,705 | $4,687 | $17,018 |
| 2018 | $3,632 | $21,705 | $4,687 | $17,018 |
| 2017 | $3,415 | $19,134 | $4,218 | $14,916 |
| 2016 | $3,354 | $19,134 | $4,218 | $14,916 |
| 2015 | $3,048 | $19,134 | $4,218 | $14,916 |
| 2014 | $2,762 | $17,338 | $3,983 | $13,355 |
| 2013 | $2,697 | $17,338 | $3,983 | $13,355 |
Source: Public Records
Map
Nearby Homes
- 5917 W 59th St
- 5810 S Austin Ave
- 5914 S Meade Ave
- 6122 W 59th St
- 6016 S Mayfield Ave
- 5727 S Meade Ave
- 6037 S Mason Ave
- 5700 S Monitor Ave
- 6004 S Moody Ave
- 5814 S Massasoit Ave
- 5643 S Meade Ave
- 6005 S Menard Ave
- 6158 W 60th St Unit 10
- 6109 S Monitor Ave
- 5621 S Moody Ave
- 6046 S Melvina Ave
- 6152 S Austin Ave
- 6058 S Massasoit Ave
- 6111 S Menard Ave
- 6204 S Mcvicker Ave
- 5831 S Austin Ave
- 5839 S Austin Ave
- 5829 S Austin Ave
- 5841 S Austin Ave
- 5827 S Austin Ave
- 5845 S Austin Ave
- 5823 S Austin Ave
- 5832 S Mason Ave
- 5836 S Mason Ave
- 5830 S Mason Ave
- 5840 S Mason Ave
- 5851 S Austin Ave
- 5826 S Mason Ave
- 5844 S Mason Ave
- 5822 S Mason Ave
- 5834 S Austin Ave
- 5830 S Austin Ave
- 5820 S Mason Ave
- 5838 S Austin Ave
- 5828 S Austin Ave