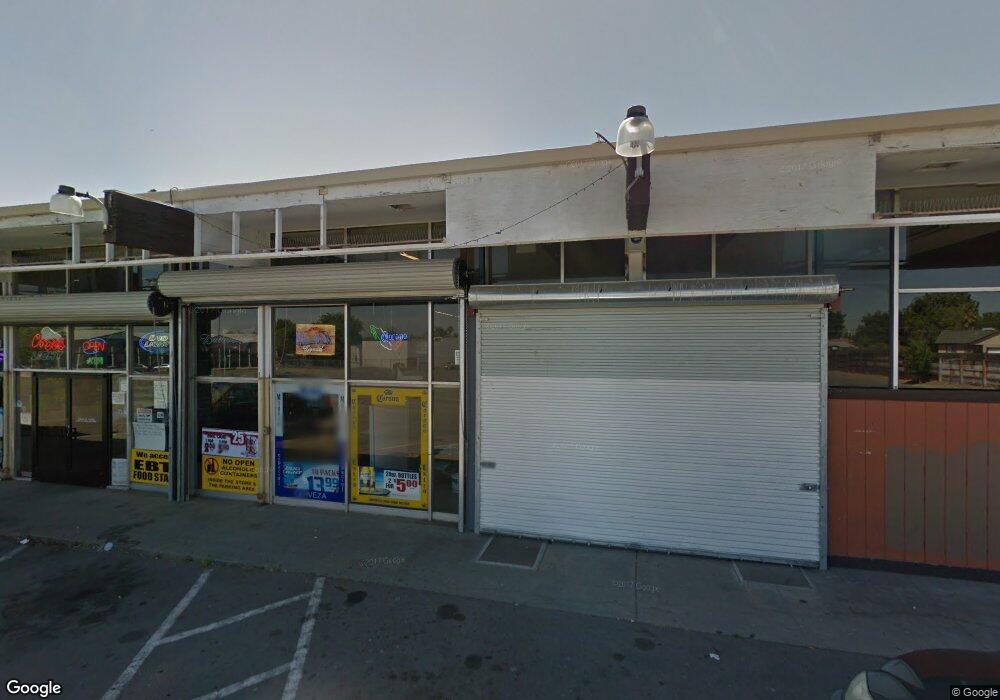
5840 Santa fe Way North Highlands, CA 95660
--
Bed
--
Bath
--
Sq Ft
3.15
Acres
About This Home
This home is located at 5840 Santa fe Way, North Highlands, CA 95660. 5840 Santa fe Way is a home located in Sacramento County with nearby schools including Kohler Elementary School, Highlands High School, and Community Outreach Academy Elementary School.
Ownership History
Date
Name
Owned For
Owner Type
Purchase Details
Closed on
Feb 4, 2020
Sold by
Auyeung Partnership
Bought by
Sidhu Investments Llc
Home Financials for this Owner
Home Financials are based on the most recent Mortgage that was taken out on this home.
Original Mortgage
$1,550,000
Outstanding Balance
$1,372,416
Interest Rate
3.6%
Mortgage Type
Commercial
Purchase Details
Closed on
Sep 12, 2002
Sold by
Corwin Yunny
Bought by
Corwin Joe E
Home Financials for this Owner
Home Financials are based on the most recent Mortgage that was taken out on this home.
Original Mortgage
$600,000
Interest Rate
6.24%
Mortgage Type
Commercial
Purchase Details
Closed on
Sep 19, 2001
Sold by
California Plan Inc
Bought by
Corwin Joe E and Corwin Yunny
Purchase Details
Closed on
Jun 24, 1999
Sold by
Joan Baker Trust and Joan
Bought by
California Plan Inc
Create a Home Valuation Report for This Property
The Home Valuation Report is an in-depth analysis detailing your home's value as well as a comparison with similar homes in the area
Home Values in the Area
Average Home Value in this Area
Purchase History
| Date | Buyer | Sale Price | Title Company |
|---|---|---|---|
| Sidhu Investments Llc | $1,200,000 | Fidelity National Title Co | |
| Corwin Joe E | -- | First American Title Co | |
| Corwin Joe E | $43,000 | Financial Title Company | |
| California Plan Inc | $44,000 | -- |
Source: Public Records
Mortgage History
| Date | Status | Borrower | Loan Amount |
|---|---|---|---|
| Open | Sidhu Investments Llc | $1,550,000 | |
| Previous Owner | Corwin Joe E | $600,000 |
Source: Public Records
Tax History Compared to Growth
Tax History
| Year | Tax Paid | Tax Assessment Tax Assessment Total Assessment is a certain percentage of the fair market value that is determined by local assessors to be the total taxable value of land and additions on the property. | Land | Improvement |
|---|---|---|---|---|
| 2025 | $14,872 | $1,312,372 | $656,186 | $656,186 |
| 2024 | $14,872 | $1,286,640 | $643,320 | $643,320 |
| 2023 | $14,976 | $1,261,412 | $630,706 | $630,706 |
| 2022 | $14,098 | $1,236,680 | $618,340 | $618,340 |
| 2021 | $14,061 | $1,212,432 | $606,216 | $606,216 |
| 2020 | $9,652 | $826,951 | $241,514 | $585,437 |
| 2019 | $9,527 | $810,737 | $236,779 | $573,958 |
| 2018 | $9,056 | $794,841 | $232,137 | $562,704 |
| 2017 | $9,288 | $779,257 | $227,586 | $551,671 |
| 2016 | $9,292 | $763,978 | $223,124 | $540,854 |
| 2015 | $8,735 | $752,503 | $219,773 | $532,730 |
| 2014 | $8,909 | $737,763 | $215,468 | $522,295 |
Source: Public Records
Map
Nearby Homes
- 5832 San Ardo Way
- 6108 Georgia Dr
- 6088 Georgia Dr
- 5705 San Ardo Way
- 5654 Rio Verde Way
- 6056 Gilman Way
- 3824 Karl Dr
- 5851 Larry Way
- 5708 San Marcos Way
- 5704 San Marcos Way
- 3840 San Novado Way
- 4321 Palm Ave Unit 98
- 4045 Heather Hill Way
- 5606 Hillsdale Blvd Unit B
- 5508 Hillsdale Blvd
- 3720 Lowry Dr
- 4407 Arrowood Ct
- 5626 Hillsdale Blvd Unit C
- 5972 Walerga Rd Unit 1
- 6229 Stagecoach Dr
- 4048 Santa fe Way
- 4052 Santa fe Way
- 4044 Santa fe Way
- 4056 Santa fe Way
- 4040 Santa fe Way
- 4036 Santa fe Way
- 5948 Gilman Way
- 5952 Gilman Way
- 4032 Santa fe Way
- 5836 San Ardo Way
- 5857 Elmo Dr
- 4028 Santa fe Way
- 5837 San Ardo Way
- 5956 Gilman Way
- 5856 Elmo Dr
- 5853 Elmo Dr
- 5955 Gilman Way
- 5905 Gilman Way
- 5963 Gilman Way
- 4056 Karl Dr