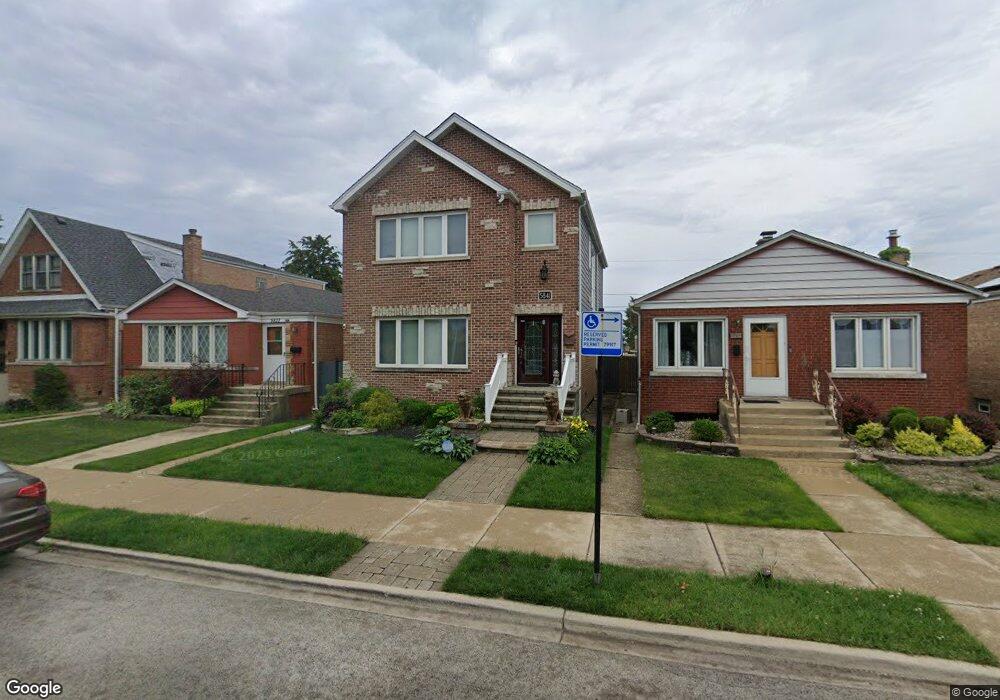
5841 W 63rd Place Chicago, IL 60638
Clearing NeighborhoodEstimated Value: $400,042 - $464,000
3
Beds
2
Baths
2,038
Sq Ft
$213/Sq Ft
Est. Value
About This Home
This home is located at 5841 W 63rd Place, Chicago, IL 60638 and is currently estimated at $434,011, approximately $212 per square foot. 5841 W 63rd Place is a home located in Cook County with nearby schools including Hale Elementary School, Kennedy High School, and St. Symphorosa Catholic School.
Ownership History
Date
Name
Owned For
Owner Type
Purchase Details
Closed on
May 15, 2023
Sold by
Alonso Javier
Bought by
Diaz Laura K
Current Estimated Value
Home Financials for this Owner
Home Financials are based on the most recent Mortgage that was taken out on this home.
Original Mortgage
$308,000
Outstanding Balance
$298,809
Interest Rate
6%
Mortgage Type
New Conventional
Estimated Equity
$135,202
Purchase Details
Closed on
Jun 7, 2004
Sold by
Vody Richard M and Vody Pauline
Bought by
Alonso Javier and Diaz Laura K
Home Financials for this Owner
Home Financials are based on the most recent Mortgage that was taken out on this home.
Original Mortgage
$235,307
Interest Rate
6.37%
Mortgage Type
FHA
Purchase Details
Closed on
Oct 13, 1994
Sold by
Kalata John M and Kalata Marilyn J
Bought by
Vody Richard M and Vody Pauline
Home Financials for this Owner
Home Financials are based on the most recent Mortgage that was taken out on this home.
Original Mortgage
$50,000
Interest Rate
8.68%
Create a Home Valuation Report for This Property
The Home Valuation Report is an in-depth analysis detailing your home's value as well as a comparison with similar homes in the area
Home Values in the Area
Average Home Value in this Area
Purchase History
| Date | Buyer | Sale Price | Title Company |
|---|---|---|---|
| Diaz Laura K | -- | Premier Title | |
| Alonso Javier | $239,000 | Pntn | |
| Vody Richard M | $118,000 | -- |
Source: Public Records
Mortgage History
| Date | Status | Borrower | Loan Amount |
|---|---|---|---|
| Open | Diaz Laura K | $308,000 | |
| Previous Owner | Alonso Javier | $235,307 | |
| Previous Owner | Vody Richard M | $50,000 |
Source: Public Records
Tax History Compared to Growth
Tax History
| Year | Tax Paid | Tax Assessment Tax Assessment Total Assessment is a certain percentage of the fair market value that is determined by local assessors to be the total taxable value of land and additions on the property. | Land | Improvement |
|---|---|---|---|---|
| 2024 | $5,449 | $35,077 | $4,956 | $30,121 |
| 2023 | $5,291 | $29,000 | $4,425 | $24,575 |
| 2022 | $5,291 | $29,000 | $4,425 | $24,575 |
| 2021 | $5,162 | $29,000 | $4,425 | $24,575 |
| 2020 | $4,785 | $24,444 | $3,540 | $20,904 |
| 2019 | $4,798 | $27,160 | $3,540 | $23,620 |
| 2018 | $5,008 | $28,624 | $3,540 | $25,084 |
| 2017 | $3,334 | $18,762 | $3,186 | $15,576 |
| 2016 | $3,279 | $18,762 | $3,186 | $15,576 |
| 2015 | $2,979 | $18,762 | $3,186 | $15,576 |
| 2014 | $2,557 | $16,246 | $3,009 | $13,237 |
| 2013 | $2,496 | $16,246 | $3,009 | $13,237 |
Source: Public Records
Map
Nearby Homes
- 5817 W 64th St
- 5749 W 64th Place
- 6152 S Austin Ave
- 5631 W 64th Place
- 6054 W 64th St
- 6058 S Massasoit Ave
- 6129 S Parkside Ave
- 6037 S Mason Ave
- 5533 W 63rd Place
- 6123 S Meade Ave
- 6135 W 63rd Place
- 6016 S Mayfield Ave
- 6155 S Moody Ave
- 6005 S Menard Ave
- 6025 S Major Ave
- 6152 W 64th Place
- 6230 W 63rd Place
- 6046 S Melvina Ave
- 6331 W 63rd St Unit 2A
- 5819 S Mason Ave
- 5843 W 63rd Place
- 5837 W 63rd Place
- 5837 W 63rd St
- 5835 W 63rd Place
- 5847 W 63rd Place
- 5831 W 63rd Place
- 5849 W 63rd Place
- 5829 W 63rd Place
- 5853 W 63rd St
- 5853 W 63rd St
- 5840 W 64th St
- 5842 W 64th St
- 5836 W 64th St
- 5834 W 64th St
- 5825 W 63rd Place
- 5855 W 63rd Place
- 5848 W 64th St
- 5830 W 64th St
- 5859 W 63rd Place
- 5823 W 63rd Place