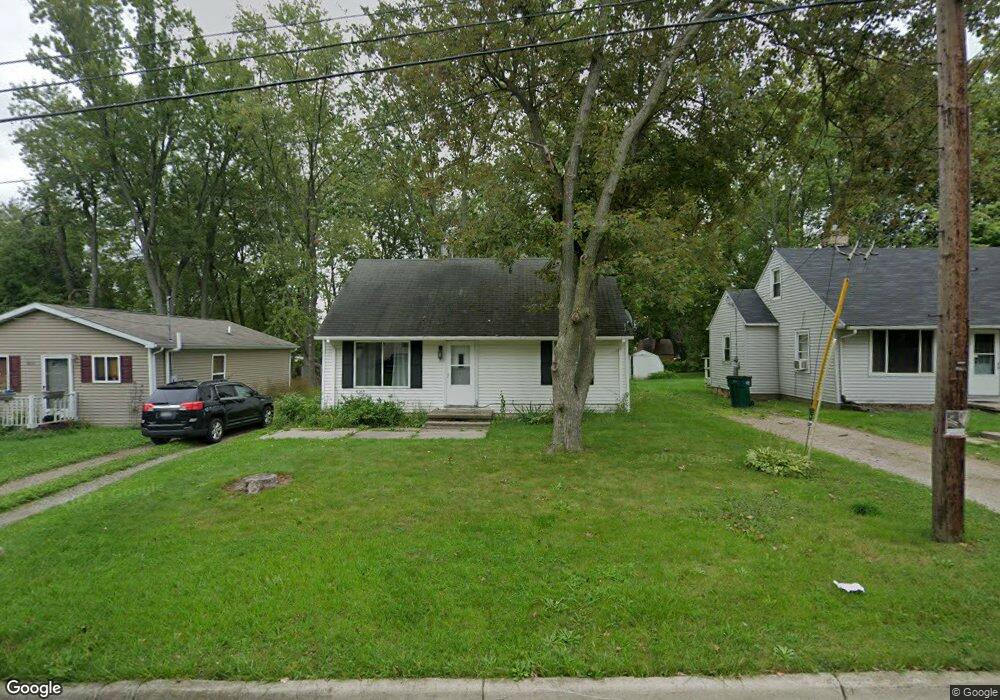
5845 Joshua St Lansing, MI 48911
Southern Lansing NeighborhoodEstimated Value: $107,887 - $160,000
3
Beds
1
Bath
1,152
Sq Ft
$117/Sq Ft
Est. Value
About This Home
This home is located at 5845 Joshua St, Lansing, MI 48911 and is currently estimated at $134,972, approximately $117 per square foot. 5845 Joshua St is a home located in Ingham County with nearby schools including Kendon School, Attwood School, and Everett High School.
Ownership History
Date
Name
Owned For
Owner Type
Purchase Details
Closed on
Nov 21, 2012
Sold by
Day Adam Douglas
Bought by
Damon Deann Marie
Current Estimated Value
Purchase Details
Closed on
Apr 16, 2007
Sold by
Velianoff Susan M
Bought by
Arno Oliver J
Home Financials for this Owner
Home Financials are based on the most recent Mortgage that was taken out on this home.
Original Mortgage
$88,457
Interest Rate
6.2%
Mortgage Type
FHA
Purchase Details
Closed on
Nov 1, 1993
Create a Home Valuation Report for This Property
The Home Valuation Report is an in-depth analysis detailing your home's value as well as a comparison with similar homes in the area
Home Values in the Area
Average Home Value in this Area
Purchase History
| Date | Buyer | Sale Price | Title Company |
|---|---|---|---|
| Damon Deann Marie | -- | None Available | |
| Arno Oliver J | $89,875 | Midstate | |
| -- | $21,500 | -- |
Source: Public Records
Mortgage History
| Date | Status | Borrower | Loan Amount |
|---|---|---|---|
| Previous Owner | Arno Oliver J | $88,457 |
Source: Public Records
Tax History Compared to Growth
Tax History
| Year | Tax Paid | Tax Assessment Tax Assessment Total Assessment is a certain percentage of the fair market value that is determined by local assessors to be the total taxable value of land and additions on the property. | Land | Improvement |
|---|---|---|---|---|
| 2025 | $1,820 | $59,900 | $7,700 | $52,200 |
| 2024 | $14 | $46,400 | $7,700 | $38,700 |
| 2023 | $1,709 | $37,500 | $7,700 | $29,800 |
| 2022 | $1,544 | $33,300 | $7,000 | $26,300 |
| 2021 | $1,512 | $29,200 | $6,100 | $23,100 |
| 2020 | $1,503 | $28,800 | $6,100 | $22,700 |
| 2019 | $1,438 | $24,500 | $6,100 | $18,400 |
| 2018 | $1,351 | $22,900 | $6,100 | $16,800 |
| 2017 | $1,292 | $22,900 | $6,100 | $16,800 |
| 2016 | $1,236 | $22,500 | $6,100 | $16,400 |
| 2015 | $1,236 | $21,700 | $12,240 | $9,460 |
| 2014 | $1,236 | $21,200 | $15,300 | $5,900 |
Source: Public Records
Map
Nearby Homes
- 5808 Orchard Ct
- 5751 Joshua St
- 5620 Kaynorth Rd
- 208 E Northrup St
- 6238 Beechfield Dr Unit 116
- 6232 Beechfield Dr Unit 113
- 6223 Beechfield Dr Unit 8
- 218 Raritan Rd
- 6300 Beechfield Dr Unit 87
- 6354 Beechfield Dr Unit 64
- 6309 Beechfield Dr Unit 45
- 6115 Lerner Way
- 5636 Ellendale Dr
- 6429 Rosedale Rd
- 5902 Hilliard Rd
- 1265 Roth Dr
- 1700 Lockbridge Dr
- 6444 Sommerset Rd
- 4719 S Pennsylvania Ave
- 201 E Syringa Dr