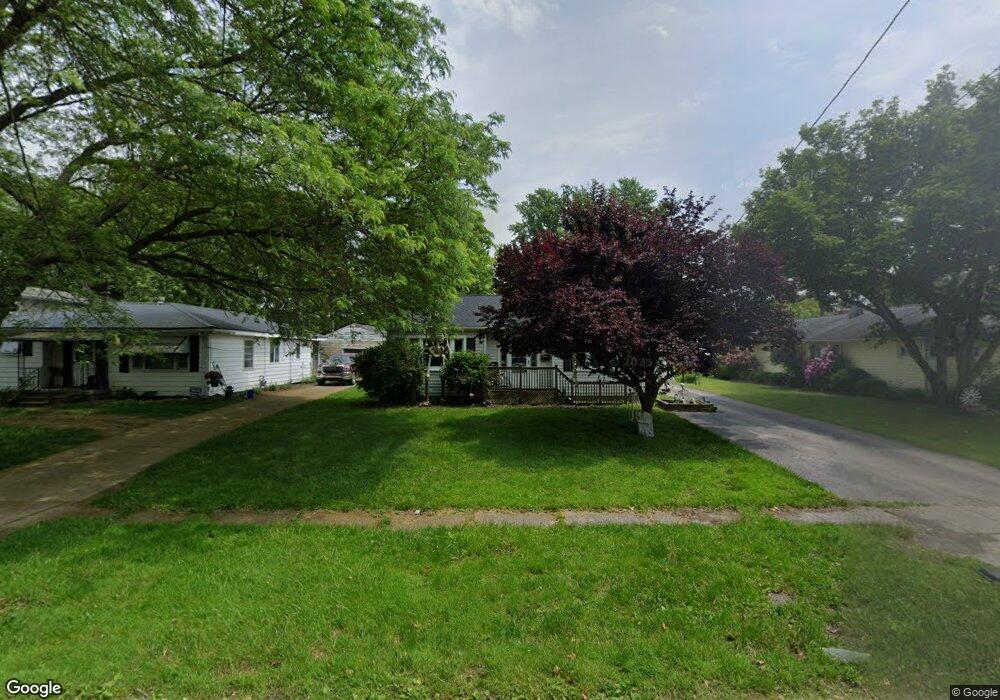
5846 Shepard Rd Ashtabula, OH 44004
Estimated Value: $123,557 - $138,000
3
Beds
1
Bath
1,054
Sq Ft
$124/Sq Ft
Est. Value
About This Home
This home is located at 5846 Shepard Rd, Ashtabula, OH 44004 and is currently estimated at $131,139, approximately $124 per square foot. 5846 Shepard Rd is a home located in Ashtabula County with nearby schools including Lakeside High School and Christian Faith Academy.
Ownership History
Date
Name
Owned For
Owner Type
Purchase Details
Closed on
Dec 9, 2014
Sold by
Kerby Amanda Lee and Kerby Amanda L
Bought by
Barger Nikki Marie and Barger Nikki M
Current Estimated Value
Home Financials for this Owner
Home Financials are based on the most recent Mortgage that was taken out on this home.
Original Mortgage
$59,183
Outstanding Balance
$45,317
Interest Rate
3.91%
Mortgage Type
New Conventional
Estimated Equity
$85,822
Purchase Details
Closed on
Sep 24, 2009
Sold by
Kerby John G
Bought by
Kerby Amanda L
Purchase Details
Closed on
Jun 27, 1997
Sold by
Peachy Betty
Bought by
Kerby John G and Kerby Amanda L
Purchase Details
Closed on
Feb 9, 1996
Sold by
Johnson Mary J
Bought by
Rosko Betty A
Home Financials for this Owner
Home Financials are based on the most recent Mortgage that was taken out on this home.
Original Mortgage
$52,250
Interest Rate
7.11%
Mortgage Type
New Conventional
Create a Home Valuation Report for This Property
The Home Valuation Report is an in-depth analysis detailing your home's value as well as a comparison with similar homes in the area
Home Values in the Area
Average Home Value in this Area
Purchase History
| Date | Buyer | Sale Price | Title Company |
|---|---|---|---|
| Barger Nikki Marie | $58,000 | Buckeye Title | |
| Kerby Amanda L | -- | None Available | |
| Kerby John G | $66,000 | -- | |
| Rosko Betty A | $55,000 | -- |
Source: Public Records
Mortgage History
| Date | Status | Borrower | Loan Amount |
|---|---|---|---|
| Open | Barger Nikki Marie | $59,183 | |
| Previous Owner | Rosko Betty A | $52,250 |
Source: Public Records
Tax History
| Year | Tax Paid | Tax Assessment Tax Assessment Total Assessment is a certain percentage of the fair market value that is determined by local assessors to be the total taxable value of land and additions on the property. | Land | Improvement |
|---|---|---|---|---|
| 2024 | $2,376 | $28,220 | $6,060 | $22,160 |
| 2023 | $1,328 | $28,220 | $6,060 | $22,160 |
| 2022 | $1,189 | $21,710 | $4,660 | $17,050 |
| 2021 | $1,202 | $21,710 | $4,660 | $17,050 |
| 2020 | $1,209 | $21,710 | $4,660 | $17,050 |
| 2019 | $1,164 | $20,860 | $5,390 | $15,470 |
| 2018 | $1,127 | $20,860 | $5,390 | $15,470 |
| 2017 | $1,129 | $20,860 | $5,390 | $15,470 |
| 2016 | $1,139 | $20,270 | $5,250 | $15,020 |
| 2015 | $1,133 | $20,270 | $5,250 | $15,020 |
| 2014 | $1,743 | $20,270 | $5,250 | $15,020 |
| 2013 | $2,001 | $23,490 | $5,220 | $18,270 |
Source: Public Records
Map
Nearby Homes
- 5860 Woodman Ave
- 5308 Benefit Ave
- 5923 Ogden Ave
- 6123 Lucas Ave
- 1024 W 54th St
- 5121 Nathan Ave
- 5705 Poplar Ave
- 5611 Poplar Ave
- 923 W 58th St
- 5422 Madison Ave
- 914 W 50th St
- 715 Holden Dr
- 4826 Cornell Ave
- 847 W 50th St
- 1120 W 43rd St
- 5425 Adams Ave
- 623 W 57th St
- 5522 Adams Ave
- 507 Bunker Hill Rd
- 919 W 41st St
- 2029 W 59th St
- 5840 Shepard Rd
- 5834 Shepard Rd
- 2030 W 59th St
- 5847 Dunbar Ave
- 5828 Shepard Rd
- 5841 Dunbar Ave
- 2018 W 59th St
- 5843 Shepard Rd
- 5847 Shepard Rd
- 5835 Dunbar Ave
- 5837 Shepard Rd
- 5912 Shepard Rd
- 2012 W 59th St
- 5822 Shepard Rd
- 2006 W 59th St
- 5829 Dunbar Ave
- 5827 Shepard Rd
- 5918 Shepard Rd
- 5823 Dunbar Ave
Your Personal Tour Guide
Ask me questions while you tour the home.