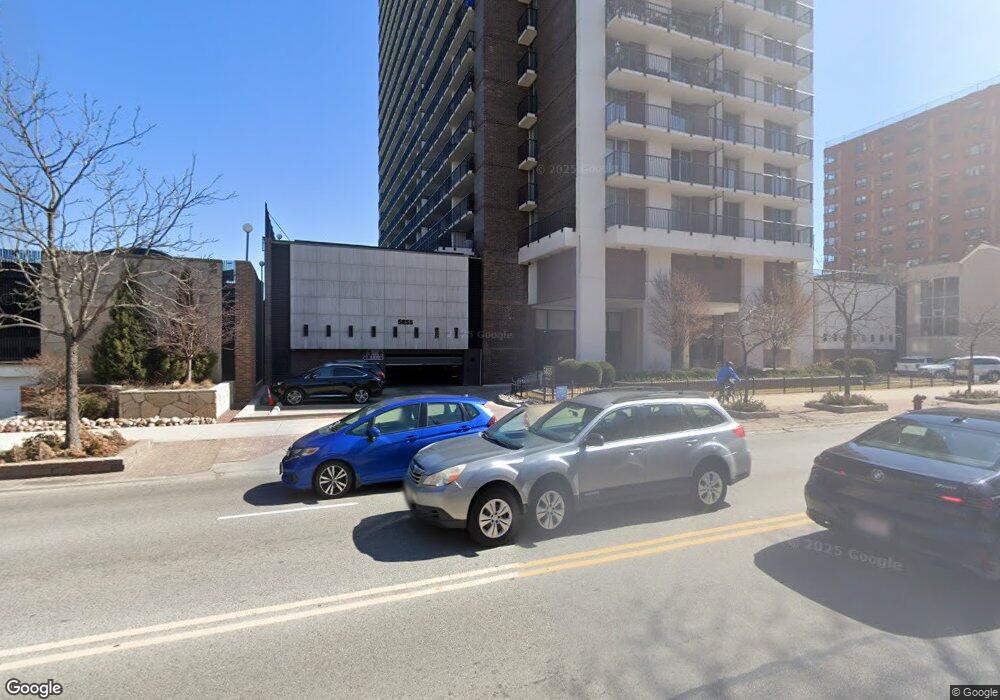
Thorndale Beach South Condominiums 5855 N Sheridan Rd Unit 13J Chicago, IL 60660
Edgewater NeighborhoodEstimated Value: $418,000 - $625,593
--
Bed
--
Bath
--
Sq Ft
0.98
Acres
About This Home
This home is located at 5855 N Sheridan Rd Unit 13J, Chicago, IL 60660 and is currently estimated at $514,398. 5855 N Sheridan Rd Unit 13J is a home located in Cook County with nearby schools including Senn High School, Sacred Heart Schools, and St Thomas Of Canterbury School.
Ownership History
Date
Name
Owned For
Owner Type
Purchase Details
Closed on
Jul 17, 2024
Sold by
Beaudoin Elaine
Bought by
Elaine M Beaudoin Trust and Beaudoin
Current Estimated Value
Purchase Details
Closed on
Mar 3, 2008
Sold by
Ramsey Clarence
Bought by
Beaudoin Ralph and Beaudoin Elaine
Home Financials for this Owner
Home Financials are based on the most recent Mortgage that was taken out on this home.
Original Mortgage
$168,000
Interest Rate
5.51%
Mortgage Type
Unknown
Purchase Details
Closed on
Jul 13, 2005
Sold by
Watson Elaine M and Beaudoin Elaine M
Bought by
Beaudoin Ralph H and Beaudoin Elaine M
Purchase Details
Closed on
Jun 5, 2002
Sold by
Watson Elaine M
Bought by
Watson Elaine M
Purchase Details
Closed on
Aug 18, 1998
Sold by
Watson Lawrence W
Bought by
Watson Elaine M
Create a Home Valuation Report for This Property
The Home Valuation Report is an in-depth analysis detailing your home's value as well as a comparison with similar homes in the area
Home Values in the Area
Average Home Value in this Area
Purchase History
| Date | Buyer | Sale Price | Title Company |
|---|---|---|---|
| Elaine M Beaudoin Trust | -- | None Listed On Document | |
| Beaudoin Ralph | $210,000 | Chicago Title Insurance Co | |
| Beaudoin Ralph H | -- | -- | |
| Watson Elaine M | -- | -- | |
| Watson Elaine M | -- | -- |
Source: Public Records
Mortgage History
| Date | Status | Borrower | Loan Amount |
|---|---|---|---|
| Previous Owner | Beaudoin Ralph | $168,000 |
Source: Public Records
Tax History Compared to Growth
Tax History
| Year | Tax Paid | Tax Assessment Tax Assessment Total Assessment is a certain percentage of the fair market value that is determined by local assessors to be the total taxable value of land and additions on the property. | Land | Improvement |
|---|---|---|---|---|
| 2024 | $9,231 | $58,407 | $3,955 | $54,452 |
| 2023 | $8,960 | $49,718 | $3,180 | $46,538 |
| 2022 | $8,960 | $49,718 | $3,180 | $46,538 |
| 2021 | $8,792 | $49,717 | $3,179 | $46,538 |
| 2020 | $7,707 | $40,181 | $1,828 | $38,353 |
| 2019 | $7,692 | $44,460 | $1,828 | $42,632 |
| 2018 | $7,561 | $44,460 | $1,828 | $42,632 |
| 2017 | $6,661 | $37,019 | $1,589 | $35,430 |
| 2016 | $6,557 | $37,019 | $1,589 | $35,430 |
| 2015 | $5,960 | $37,019 | $1,589 | $35,430 |
| 2014 | $5,003 | $31,367 | $1,212 | $30,155 |
| 2013 | $4,885 | $31,367 | $1,212 | $30,155 |
Source: Public Records
About Thorndale Beach South Condominiums
Map
Nearby Homes
- 5901 N Sheridan Rd Unit 9G
- 5863 N Kenmore Ave Unit 2
- 5950 N Kenmore Ave Unit 202
- 5950 N Kenmore Ave Unit 306
- 6007 N Sheridan Rd Unit 6H
- 6007 N Sheridan Rd Unit 24H
- 6007 N Sheridan Rd Unit 17A
- 6007 N Sheridan Rd Unit 20H
- 6007 N Sheridan Rd Unit 37B
- 6007 N Sheridan Rd Unit 7J
- 6007 N Sheridan Rd Unit 25F
- 6007 N Sheridan Rd Unit 17DF
- 6007 N Sheridan Rd Unit 25E
- 6007 N Sheridan Rd Unit 12B
- 6030 N Sheridan Rd Unit 404
- 6030 N Sheridan Rd Unit 1710
- 5757 N Sheridan Rd Unit 5J
- 5757 N Sheridan Rd Unit 18J
- 5757 N Sheridan Rd Unit 3J
- 6033 N Sheridan Rd Unit 18K
- 5855 N Sheridan Rd Unit 14CE
- 5855 N Sheridan Rd Unit 21E
- 5855 N Sheridan Rd Unit 13K
- 5855 N Sheridan Rd Unit 6G
- 5855 N Sheridan Rd Unit 11E
- 5855 N Sheridan Rd Unit 22K
- 5855 N Sheridan Rd Unit 5E
- 5855 N Sheridan Rd Unit 6E
- 5855 N Sheridan Rd Unit 10F
- 5855 N Sheridan Rd Unit 14E
- 5855 N Sheridan Rd Unit 22J
- 5855 N Sheridan Rd Unit 12E
- 5855 N Sheridan Rd Unit 20B
- 5855 N Sheridan Rd Unit 18C
- 5855 N Sheridan Rd Unit 15D
- 5855 N Sheridan Rd Unit 11A
- 5855 N Sheridan Rd Unit 24J
- 5855 N Sheridan Rd Unit 6H
- 5855 N Sheridan Rd Unit 25E
- 5855 N Sheridan Rd Unit 12A