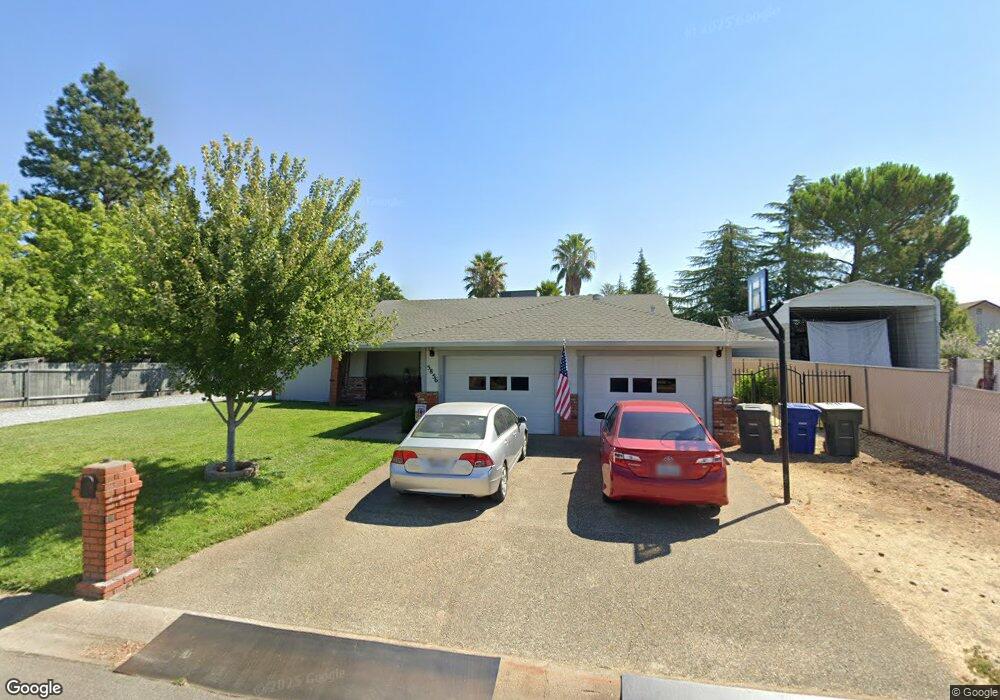
5856 Mountain View Dr Unit ONE Redding, CA 96003
Midway NeighborhoodEstimated Value: $434,000 - $557,000
4
Beds
3
Baths
2,550
Sq Ft
$202/Sq Ft
Est. Value
About This Home
This home is located at 5856 Mountain View Dr Unit ONE, Redding, CA 96003 and is currently estimated at $515,130, approximately $202 per square foot. 5856 Mountain View Dr Unit ONE is a home located in Shasta County with nearby schools including Rocky Point Charter School, Redding STEM Academy, and Bethel Christian School.
Ownership History
Date
Name
Owned For
Owner Type
Purchase Details
Closed on
Aug 22, 2013
Sold by
Thatcher Jack Richard
Bought by
Sullivan Robert O and Sullivan Kristy O
Current Estimated Value
Home Financials for this Owner
Home Financials are based on the most recent Mortgage that was taken out on this home.
Original Mortgage
$172,000
Outstanding Balance
$127,603
Interest Rate
4.33%
Mortgage Type
New Conventional
Estimated Equity
$387,527
Purchase Details
Closed on
Apr 7, 2009
Sold by
Fdic
Bought by
Thatcher Jack Richard and Thatcher Alma L
Home Financials for this Owner
Home Financials are based on the most recent Mortgage that was taken out on this home.
Original Mortgage
$180,000
Interest Rate
4.82%
Mortgage Type
Unknown
Purchase Details
Closed on
Dec 1, 2008
Sold by
Mcewan Connie L
Bought by
Indymac Bank Fsb
Purchase Details
Closed on
Jun 11, 2002
Sold by
Nomicos Flavia
Bought by
Mcewan Connie L
Home Financials for this Owner
Home Financials are based on the most recent Mortgage that was taken out on this home.
Original Mortgage
$154,000
Interest Rate
6.86%
Purchase Details
Closed on
Mar 26, 1999
Sold by
Nomicos N and F
Bought by
Nomicos Nicholas and Nomicos Flavia
Home Financials for this Owner
Home Financials are based on the most recent Mortgage that was taken out on this home.
Original Mortgage
$124,000
Interest Rate
6.79%
Purchase Details
Closed on
Mar 25, 1999
Sold by
Nomicos Nicholas and Nomicos Flavia
Bought by
Nomicos Nicholas and Nomicos Flavia
Home Financials for this Owner
Home Financials are based on the most recent Mortgage that was taken out on this home.
Original Mortgage
$124,000
Interest Rate
6.79%
Purchase Details
Closed on
Oct 23, 1997
Sold by
Nomicos Nicholas and Nomicos Flavia
Bought by
Nomicos Nicholas and Nomicos Flavia
Home Financials for this Owner
Home Financials are based on the most recent Mortgage that was taken out on this home.
Original Mortgage
$120,000
Interest Rate
7.49%
Purchase Details
Closed on
Oct 21, 1997
Sold by
Metro Charles E Investment Co
Bought by
Nomicos Nicholas and Nomicos Flavia
Home Financials for this Owner
Home Financials are based on the most recent Mortgage that was taken out on this home.
Original Mortgage
$120,000
Interest Rate
7.49%
Create a Home Valuation Report for This Property
The Home Valuation Report is an in-depth analysis detailing your home's value as well as a comparison with similar homes in the area
Home Values in the Area
Average Home Value in this Area
Purchase History
| Date | Buyer | Sale Price | Title Company |
|---|---|---|---|
| Sullivan Robert O | $340,000 | Placer Title Company | |
| Thatcher Jack Richard | $260,000 | Chicago Title Company | |
| Indymac Bank Fsb | $210,574 | None Available | |
| Mcewan Connie L | $225,000 | Fidelity National Title Co | |
| Nomicos Nicholas | -- | First American Title Co | |
| Nomicos Nicholas | -- | First American Title Co | |
| Nomicos Nicholas | -- | Chicago Title Co | |
| Nomicos Nicholas | $160,000 | Chicago Title Co |
Source: Public Records
Mortgage History
| Date | Status | Borrower | Loan Amount |
|---|---|---|---|
| Open | Sullivan Robert O | $172,000 | |
| Previous Owner | Thatcher Jack Richard | $180,000 | |
| Previous Owner | Mcewan Connie L | $154,000 | |
| Previous Owner | Nomicos Nicholas | $124,000 | |
| Previous Owner | Nomicos Nicholas | $120,000 |
Source: Public Records
Tax History Compared to Growth
Tax History
| Year | Tax Paid | Tax Assessment Tax Assessment Total Assessment is a certain percentage of the fair market value that is determined by local assessors to be the total taxable value of land and additions on the property. | Land | Improvement |
|---|---|---|---|---|
| 2025 | $4,397 | $416,783 | $49,029 | $367,754 |
| 2024 | $4,313 | $408,612 | $48,068 | $360,544 |
| 2023 | $4,313 | $400,601 | $47,126 | $353,475 |
| 2022 | $4,197 | $392,747 | $46,202 | $346,545 |
| 2021 | $4,141 | $385,047 | $45,297 | $339,750 |
| 2020 | $4,123 | $381,100 | $44,833 | $336,267 |
| 2019 | $3,995 | $373,628 | $43,954 | $329,674 |
| 2018 | $3,995 | $366,303 | $43,093 | $323,210 |
| 2017 | $3,928 | $359,122 | $42,249 | $316,873 |
| 2016 | $3,755 | $352,081 | $41,421 | $310,660 |
| 2015 | $3,695 | $346,793 | $40,799 | $305,994 |
| 2014 | $3,721 | $340,000 | $40,000 | $300,000 |
Source: Public Records
Map
Nearby Homes
- 5663 Terra Linda Way
- 5589 Trish Ct
- 6572 Jonella Way
- 7831 Terra Linda Way
- 948 & 950 Hawley
- 5810 Diamond Ridge Dr
- 846 Ridge Rd
- 671 Valleybrook Dr
- 5334 Valleyridge Dr
- 5808 Constitution Way
- 525 N Boulder Dr
- 5852 Avery Way
- 6040 Constitution Way
- 60 Rose Ln
- 19219 Nike Ct
- 1495 Spanish Bay Dr
- 481 Twin View Blvd
- 633 Marijean Way
- 1381 Chaos Walk
- 11632 Ridgewood Rd
- 5856 Mountain View Dr
- 574 Collyer Dr
- 596 Collyer Dr
- 5840 Mountain View Dr
- 608 Collyer Dr
- 5851 Mountain View Dr Unit II
- 5850 Mountain View Dr
- 5875 Mountain View Dr
- 622 Collyer Dr
- 5835 Mountain View Dr
- 5822 Mountain View Dr
- 5899 Mountain View Dr
- 575 Collyer Dr
- 597 Collyer Dr
- 5825 Mountain View Dr
- 644 Collyer Dr
- 609 Collyer Dr
- 6497 Terra Linda Way
- 5802 Mountain View Dr
- 6463 Terra Linda Way