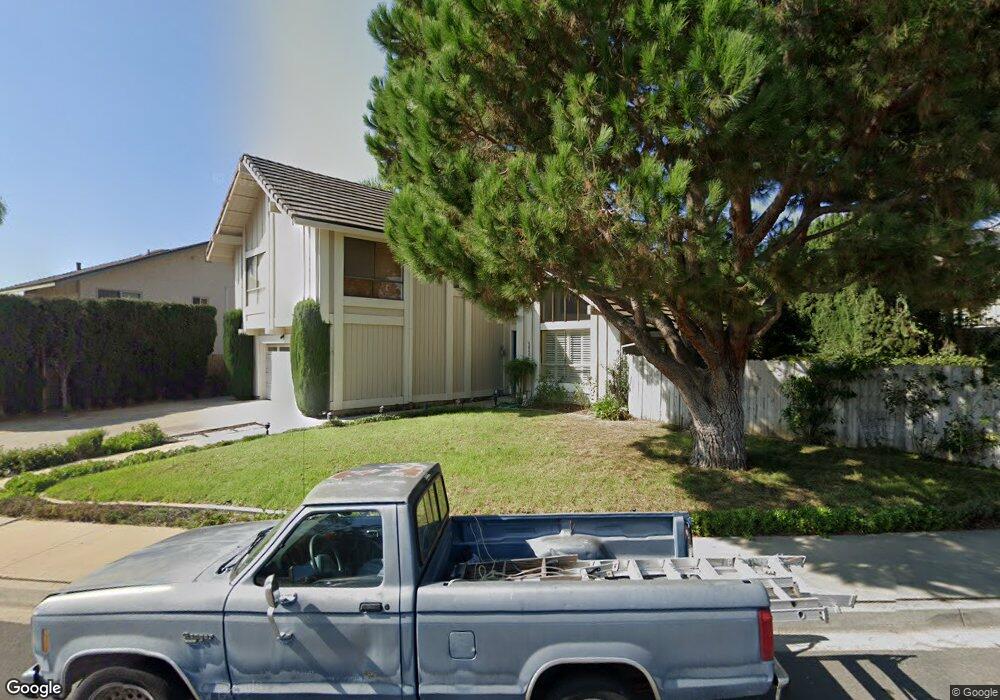
5859 Mulberry Ridge Dr Camarillo, CA 93012
Estimated Value: $1,008,000 - $1,090,000
4
Beds
3
Baths
2,032
Sq Ft
$514/Sq Ft
Est. Value
About This Home
This home is located at 5859 Mulberry Ridge Dr, Camarillo, CA 93012 and is currently estimated at $1,043,612, approximately $513 per square foot. 5859 Mulberry Ridge Dr is a home located in Ventura County with nearby schools including Tierra Linda Elementary School, Las Colinas Middle School, and Adolfo Camarillo High School.
Ownership History
Date
Name
Owned For
Owner Type
Purchase Details
Closed on
Jun 3, 2013
Sold by
Meier Gregory L and Meier Linda P
Bought by
Meier Gregory L and Meier Linda P
Current Estimated Value
Purchase Details
Closed on
Mar 27, 2000
Sold by
Wilkinson Francis X
Bought by
Meier Gregory L and Meier Linda P
Home Financials for this Owner
Home Financials are based on the most recent Mortgage that was taken out on this home.
Original Mortgage
$252,700
Interest Rate
8.18%
Purchase Details
Closed on
May 14, 1996
Sold by
Agness Robert E and Agness Shirley A
Bought by
Wilkinson Francis X and Wilkinson Stefani Brie
Home Financials for this Owner
Home Financials are based on the most recent Mortgage that was taken out on this home.
Original Mortgage
$192,000
Interest Rate
8.25%
Create a Home Valuation Report for This Property
The Home Valuation Report is an in-depth analysis detailing your home's value as well as a comparison with similar homes in the area
Home Values in the Area
Average Home Value in this Area
Purchase History
| Date | Buyer | Sale Price | Title Company |
|---|---|---|---|
| Meier Gregory L | -- | None Available | |
| Meier Gregory L | $350,000 | Lawyers Title Company | |
| Wilkinson Francis X | $240,000 | Fidelity National Title Co |
Source: Public Records
Mortgage History
| Date | Status | Borrower | Loan Amount |
|---|---|---|---|
| Previous Owner | Meier Gregory L | $252,700 | |
| Previous Owner | Wilkinson Francis X | $192,000 | |
| Closed | Meier Gregory L | $27,300 |
Source: Public Records
Tax History
| Year | Tax Paid | Tax Assessment Tax Assessment Total Assessment is a certain percentage of the fair market value that is determined by local assessors to be the total taxable value of land and additions on the property. | Land | Improvement |
|---|---|---|---|---|
| 2025 | $5,408 | $496,923 | $215,164 | $281,759 |
| 2024 | $5,408 | $487,180 | $210,945 | $276,235 |
| 2023 | $5,641 | $517,028 | $206,809 | $310,219 |
| 2022 | $5,623 | $506,891 | $202,754 | $304,137 |
| 2021 | $5,420 | $496,952 | $198,778 | $298,174 |
| 2020 | $5,400 | $491,858 | $196,741 | $295,117 |
| 2019 | $5,374 | $482,215 | $192,884 | $289,331 |
| 2018 | $5,274 | $472,760 | $189,102 | $283,658 |
| 2017 | $4,963 | $463,492 | $185,395 | $278,097 |
| 2016 | $4,843 | $454,405 | $181,760 | $272,645 |
| 2015 | $4,791 | $447,581 | $179,031 | $268,550 |
| 2014 | $4,679 | $438,816 | $175,525 | $263,291 |
Source: Public Records
Map
Nearby Homes
- 1356 El Lazo Ct
- 13221 Village 13
- 1288 Old Ranch Rd
- 15421 Village 15 Unit 15
- 13215 Village 13
- 11251 Village 11
- 6075 Arabian Place
- 7177 Village 7
- 6250 Calle Bodega
- 5154 Village 5
- 31330 Village 31
- 5142 Village 5
- 7202 Village 7 Unit 7
- 7115 Village 7 Unit 7
- 23220 Village 23 Unit 23
- 33107 Village 33
- 30110 Village 30 Unit 30
- 1425 Calle Lozano
- 17164 Village 17
- 31310 Village 31 Unit 31
- 5815 Mulberry Ridge Dr
- 5774 Willow View Dr
- 5790 Willow View Dr
- 5758 Willow View Dr
- 5803 Mulberry Ridge Dr
- 5860 Mulberry Ridge Dr
- 5824 Mulberry Ridge Dr
- 5872 Mulberry Ridge Dr
- 5742 Willow View Dr
- 5816 Mulberry Ridge Dr
- 5884 Mulberry Ridge Dr
- 5789 Mulberry Ridge Dr
- 5804 Mulberry Ridge Dr
- 5848 Mulberry Ridge Dr
- 5836 Mulberry Ridge Dr
- 5892 Mulberry Ridge Dr
- 5724 Willow View Dr
- 5755 Willow View Dr
- 5767 Willow View Dr
- 5790 Mulberry Ridge Dr
Your Personal Tour Guide
Ask me questions while you tour the home.