
5861 Sperry Dr Citrus Heights, CA 95621
Park Oaks Neighborhood
3
Beds
2.5
Baths
1,433
Sq Ft
$306/mo
HOA Fee
Highlights
- 1 Fireplace
- Formal Dining Room
- Central Heating and Cooling System
- Walk-In Pantry
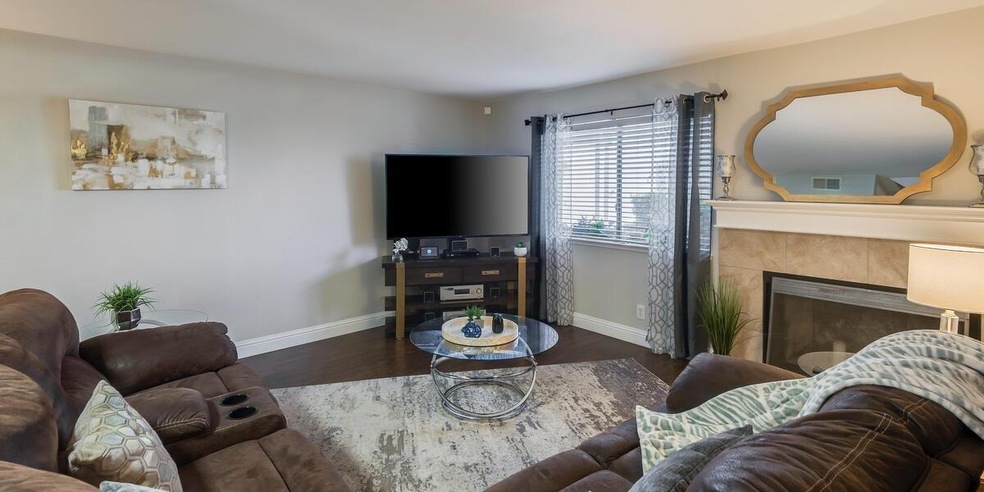
- Living Room
About This Home
As of February 2025Welcome home to this beautiful bright updated 3 bedroom, 2.5 bathroom home. Featuring updated flooring throughout the living spaces, updated kitchen and bathrooms, updated lighting throughout, a balcony off of the master bedroom, and a large private outdoor space, a 2 car garage, and a newer HVAC. Centrally located near shopping, dining, schools, and parks. Watch video tour at: https://www.youtube.com/watch?v=oFAkHIC4XvI
Last Agent to Sell the Property
Inspired Real Estate Group, Inc. License #02007036 Listed on: 02/17/2021
Property Details
Home Type
- Condominium
Est. Annual Taxes
- $4,116
Year Built
- Built in 1979
HOA Fees
- $306 Monthly HOA Fees
Parking
- 2 Car Garage
- Side Facing Garage
Home Design
- Planned Development
- Concrete Foundation
- Frame Construction
- Composition Roof
- Concrete Perimeter Foundation
Interior Spaces
- 1,433 Sq Ft Home
- 2-Story Property
- 1 Fireplace
- Living Room
- Formal Dining Room
- Laminate Flooring
- Walk-In Pantry
- Laundry in unit
Bedrooms and Bathrooms
- 3 Bedrooms
- Separate Shower
Home Security
Utilities
- Central Heating and Cooling System
- 220 Volts
Listing and Financial Details
- Assessor Parcel Number 243-0361-015-0000
Community Details
Overview
- Association fees include maintenanceexterior maintenancegrounds
- Mandatory home owners association
Security
- Carbon Monoxide Detectors
Ownership History
Date
Name
Owned For
Owner Type
Purchase Details
Listed on
Nov 12, 2024
Closed on
Feb 20, 2025
Sold by
Princess D Walton Revocable Living Trust and Walton Princess D
Bought by
Braga Rhonda K
Seller's Agent
Jenifer Fotheringham
Wesely & Associates
Buyer's Agent
Kim Cochrane
Navigate Realty
List Price
$364,900
Sold Price
$357,000
Premium/Discount to List
-$7,900
-2.16%
Views
139
Home Financials for this Owner
Home Financials are based on the most recent Mortgage that was taken out on this home.
Avg. Annual Appreciation
16.84%
Purchase Details
Listed on
Feb 17, 2021
Closed on
Mar 25, 2021
Sold by
Sanbeck Daryl and Sanbeck Carrie
Bought by
Walton Princess D and The Princess D Walton Revocabl
Seller's Agent
Lisa Chandler-Oliver
Inspired Real Estate Group, Inc.
Buyer's Agent
Jenifer Fotheringham
Wesely & Associates
Sold Price
$322,000
Home Financials for this Owner
Home Financials are based on the most recent Mortgage that was taken out on this home.
Avg. Annual Appreciation
2.68%
Original Mortgage
$305,900
Interest Rate
2.73%
Mortgage Type
New Conventional
Purchase Details
Listed on
Nov 2, 2018
Closed on
Feb 27, 2019
Sold by
Padilla Becky
Bought by
Sanbeck Daryl and Sanbeck Carrie
Seller's Agent
Michael Shumaker
Security Pacific Real Estate
Buyer's Agent
Lisa Chandler
Keller Williams Realty
List Price
$239,900
Sold Price
$245,000
Premium/Discount to List
$5,100
2.13%
Home Financials for this Owner
Home Financials are based on the most recent Mortgage that was taken out on this home.
Avg. Annual Appreciation
14.41%
Original Mortgage
$8,575
Interest Rate
4.3%
Mortgage Type
Stand Alone Second
Purchase Details
Closed on
May 5, 2016
Sold by
Kibby Road Llc
Bought by
Padilla Becky
Home Financials for this Owner
Home Financials are based on the most recent Mortgage that was taken out on this home.
Original Mortgage
$178,600
Interest Rate
3.71%
Mortgage Type
New Conventional
Purchase Details
Closed on
Feb 18, 2016
Sold by
Murdock Ellen L
Bought by
Kibby Road Llc
Purchase Details
Closed on
Jan 26, 2009
Sold by
Federal National Mortgage Association
Bought by
Murdock Ellen L
Home Financials for this Owner
Home Financials are based on the most recent Mortgage that was taken out on this home.
Original Mortgage
$138,390
Interest Rate
5.14%
Mortgage Type
FHA
Purchase Details
Closed on
Jul 21, 2008
Sold by
Kuzminskaya Olesya and Kuzminskaya Raisa
Bought by
Federal National Mortgage Association
Purchase Details
Closed on
Mar 10, 2006
Sold by
Yalanji Olesya
Bought by
Ialanji Roman and Yalanji Olesya
Home Financials for this Owner
Home Financials are based on the most recent Mortgage that was taken out on this home.
Original Mortgage
$97,930
Interest Rate
6.35%
Mortgage Type
Credit Line Revolving
Purchase Details
Closed on
Jan 15, 2003
Sold by
Yalangi Roman
Bought by
Kuzminskaya Olesya
Home Financials for this Owner
Home Financials are based on the most recent Mortgage that was taken out on this home.
Original Mortgage
$146,100
Interest Rate
6.15%
Purchase Details
Closed on
Jan 3, 2003
Sold by
Taylor Rudolph V and Taylor Betty J
Bought by
Kuzminskaya Olesya and Kuzminskaya Raisa
Home Financials for this Owner
Home Financials are based on the most recent Mortgage that was taken out on this home.
Original Mortgage
$146,100
Interest Rate
6.15%
Similar Homes in the area
-
$249,500
- 1 Bed
- 1 Bath
- 700 Sq Ft
- 7711 Juan Way
- Fair Oaks, CA
MAJOR PRICE REDUCTION!!! Charming Single-Story Condo in a Gated Community! This cozy 1-bedroom, 1-bath condo is conveniently located near shopping, dining, and entertainment. The kitchen features granite countertops, a bright window over the sink, modern white cabinetry, and stainless steel appliances including a dishwasher, Refrigerator, and stove all included. Enjoy easy-care laminate
John Leles Coldwell Banker Realty
Create a Home Valuation Report for This Property
The Home Valuation Report is an in-depth analysis detailing your home's value as well as a comparison with similar homes in the area
Home Values in the Area
Average Home Value in this Area
Purchase History
| Date | Type | Sale Price | Title Company |
|---|---|---|---|
| Grant Deed | $357,000 | Fidelity National Title Compan | |
| Grant Deed | $322,000 | Fidelity National Title Co | |
| Grant Deed | $245,000 | Placer Title Company | |
| Grant Deed | $200,000 | First American Title Company | |
| Trustee Deed | $146,500 | None Available | |
| Grant Deed | $140,000 | Commonwealth Land Title Co | |
| Trustee Deed | $153,053 | Landsafe Title | |
| Interfamily Deed Transfer | -- | None Available | |
| Grant Deed | -- | None Available | |
| Interfamily Deed Transfer | -- | Fidelity National Title Co | |
| Interfamily Deed Transfer | -- | Fidelity National Title Co | |
| Grant Deed | $154,000 | Fidelity National Title Co |
Source: Public Records
Mortgage History
| Date | Status | Loan Amount | Loan Type |
|---|---|---|---|
| Previous Owner | $305,900 | New Conventional | |
| Previous Owner | $240,746 | FHA | |
| Previous Owner | $8,575 | Stand Alone Second | |
| Previous Owner | $240,562 | FHA | |
| Previous Owner | $178,600 | New Conventional | |
| Previous Owner | $8,670 | Unknown | |
| Previous Owner | $138,390 | FHA | |
| Previous Owner | $97,930 | Credit Line Revolving | |
| Previous Owner | $50,000 | Credit Line Revolving | |
| Previous Owner | $189,000 | Unknown | |
| Previous Owner | $146,100 | No Value Available | |
| Previous Owner | $80,000 | Unknown |
Source: Public Records
Property History
| Date | Event | Price | Change | Sq Ft Price |
|---|---|---|---|---|
| 07/06/2025 07/06/25 | For Sale | $359,000 | +0.6% | $251 / Sq Ft |
| 02/21/2025 02/21/25 | Sold | $357,000 | -2.2% | $249 / Sq Ft |
| 02/16/2025 02/16/25 | Pending | -- | -- | -- |
| 02/01/2025 02/01/25 | For Sale | $364,900 | +2.2% | $255 / Sq Ft |
| 02/01/2025 02/01/25 | Off Market | $357,000 | -- | -- |
| 12/20/2024 12/20/24 | Price Changed | $364,900 | -1.4% | $255 / Sq Ft |
| 11/12/2024 11/12/24 | For Sale | $370,000 | 0.0% | $258 / Sq Ft |
| 08/14/2024 08/14/24 | For Rent | $2,475 | 0.0% | -- |
| 03/29/2021 03/29/21 | Sold | $322,000 | +9.2% | $225 / Sq Ft |
| 03/07/2021 03/07/21 | Pending | -- | -- | -- |
| 03/05/2021 03/05/21 | For Sale | -- | -- | -- |
| 02/17/2021 02/17/21 | Pending | -- | -- | -- |
| 02/17/2021 02/17/21 | For Sale | $295,000 | +20.4% | $206 / Sq Ft |
| 03/19/2019 03/19/19 | Sold | $245,000 | +2.1% | $171 / Sq Ft |
| 02/05/2019 02/05/19 | Pending | -- | -- | -- |
| 01/22/2019 01/22/19 | For Sale | $239,900 | 0.0% | $167 / Sq Ft |
| 01/16/2019 01/16/19 | Pending | -- | -- | -- |
| 01/15/2019 01/15/19 | For Sale | $239,900 | 0.0% | $167 / Sq Ft |
| 01/10/2019 01/10/19 | Pending | -- | -- | -- |
| 01/02/2019 01/02/19 | Price Changed | $239,900 | -3.1% | $167 / Sq Ft |
| 12/04/2018 12/04/18 | Price Changed | $247,500 | -4.6% | $173 / Sq Ft |
| 11/15/2018 11/15/18 | Price Changed | $259,500 | -2.4% | $181 / Sq Ft |
| 11/02/2018 11/02/18 | For Sale | $265,900 | -- | $186 / Sq Ft |
Source: MetroList
Tax History Compared to Growth
Tax History
| Year | Tax Paid | Tax Assessment Tax Assessment Total Assessment is a certain percentage of the fair market value that is determined by local assessors to be the total taxable value of land and additions on the property. | Land | Improvement |
|---|---|---|---|---|
| 2024 | $4,116 | $341,707 | $74,284 | $267,423 |
| 2023 | $4,011 | $335,008 | $72,828 | $262,180 |
| 2022 | $3,991 | $328,440 | $71,400 | $257,040 |
| 2021 | $2,996 | $252,488 | $75,746 | $176,742 |
| 2020 | $2,939 | $249,900 | $74,970 | $174,930 |
| 2019 | $2,569 | $212,238 | $47,754 | $164,484 |
| 2018 | $3,529 | $208,077 | $46,818 | $161,259 |
| 2017 | $2,515 | $203,998 | $45,900 | $158,098 |
| 2016 | $1,793 | $152,287 | $94,636 | $57,651 |
| 2015 | $1,762 | $150,001 | $93,215 | $56,786 |
| 2014 | $1,726 | $147,064 | $91,390 | $55,674 |
Source: Public Records
Agents Affiliated with this Home
-
Kim Cochrane
Seller's Agent in 2025
Kim Cochrane
Navigate Realty
(408) 529-2887
1 in this area
71 Total Sales
-
Jenifer Fotheringham
Seller's Agent in 2025
Jenifer Fotheringham
Wesely & Associates Inc.
(916) 247-7971
2 in this area
70 Total Sales
-
Tim Wesely
Seller Co-Listing Agent in 2025
Tim Wesely
Wesely & Associates Inc.
(916) 606-1486
2 in this area
37 Total Sales
-
D
Buyer's Agent in 2025
Default zSystem
zdefault Office
-
Lisa Chandler-Oliver
Seller's Agent in 2021
Lisa Chandler-Oliver
Inspired Real Estate Group, Inc.
(916) 580-9403
2 in this area
126 Total Sales
-
Michael Shumaker
Seller's Agent in 2019
Michael Shumaker
Security Pacific Real Estate
(916) 799-0108
47 Total Sales
Map
Source: MetroList
MLS Number: 221007420
APN: 243-0361-015
Disclaimer: Certain information contained herein is derived from information provided by parties other than Homes.com. All information provided is deemed reliable, but is not guaranteed to be accurate and should be independently verified.
![]() IDX information is provided exclusively for personal, non-commercial use, and may not be used for any purpose other than to identify prospective properties consumers may be interested in purchasing. Information is deemed reliable but not guaranteed.
IDX information is provided exclusively for personal, non-commercial use, and may not be used for any purpose other than to identify prospective properties consumers may be interested in purchasing. Information is deemed reliable but not guaranteed.
Nearby Homes
- 7235 La Luna Ct
- 5873 Sperry Dr
- 7239 Adobe Casa Ct
- 6000 Rowan Way
- 7210 Grady Dr
- 5829 San Juan Ave Unit 34
- 7200 Spicer Dr
- 7309 Villa Del Sol Ln
- 6164 Peoria Dr
- 7407 Skylark Ct
- 7210 Greenback Ln
- 6071 Brooktree Dr
- 6948 Brookhaven Way
- 5729 La Field Dr
- 5712 San Juan Ave
- 7507 Skyline Ct
- 7418 Ranch Ave
- 5615 Arlyn Way
- 5801 Southgrove Dr
- 5718 Southgrove Dr