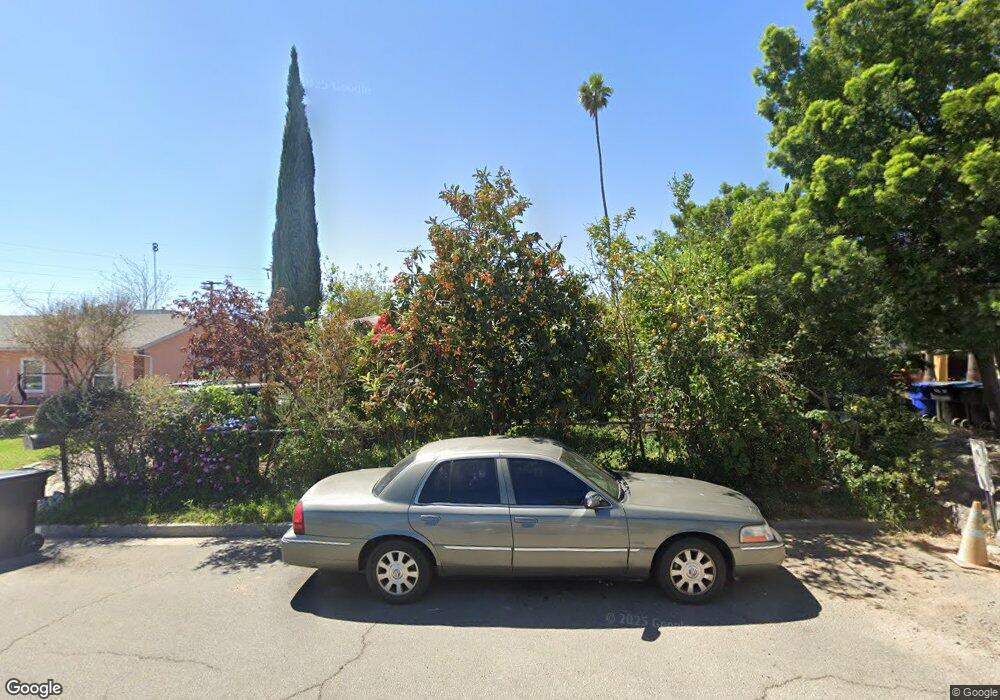
5868 De la Vista Riverside, CA 92509
Estimated Value: $447,000 - $500,000
3
Beds
1
Bath
999
Sq Ft
$483/Sq Ft
Est. Value
About This Home
This home is located at 5868 De la Vista, Riverside, CA 92509 and is currently estimated at $482,875, approximately $483 per square foot. 5868 De la Vista is a home located in Riverside County with nearby schools including Pacific Avenue Academy of Music, Mission Middle School, and Rubidoux High School.
Ownership History
Date
Name
Owned For
Owner Type
Purchase Details
Closed on
Jul 24, 2018
Sold by
Salinas Gabino and Salinas Maria
Bought by
Salinas Gabino and Salinas Maria
Current Estimated Value
Purchase Details
Closed on
Aug 25, 2004
Sold by
Salinas Gabino and Salinas Maria
Bought by
Salinas Gabino and Salinas Maria
Home Financials for this Owner
Home Financials are based on the most recent Mortgage that was taken out on this home.
Original Mortgage
$62,808
Interest Rate
6.06%
Mortgage Type
FHA
Purchase Details
Closed on
Jan 19, 1995
Sold by
Hud
Bought by
Salinas Gabino and Salinas Maria
Home Financials for this Owner
Home Financials are based on the most recent Mortgage that was taken out on this home.
Original Mortgage
$63,913
Interest Rate
9.09%
Mortgage Type
FHA
Purchase Details
Closed on
Oct 17, 1994
Sold by
Barclaysamerican/Mtg Corp
Bought by
Hud
Purchase Details
Closed on
Jul 20, 1994
Sold by
Professional Foreclosure Corp
Bought by
Barclaysamerican/Mtg Corp
Create a Home Valuation Report for This Property
The Home Valuation Report is an in-depth analysis detailing your home's value as well as a comparison with similar homes in the area
Home Values in the Area
Average Home Value in this Area
Purchase History
| Date | Buyer | Sale Price | Title Company |
|---|---|---|---|
| Salinas Gabino | -- | None Available | |
| Salinas Gabino | -- | Placer Title Company | |
| Salinas Gabino | $32,750 | United Title Co | |
| Hud | -- | First Southwestern Title Co | |
| Barclaysamerican/Mtg Corp | $127,011 | First Southwestern Title Co |
Source: Public Records
Mortgage History
| Date | Status | Borrower | Loan Amount |
|---|---|---|---|
| Closed | Salinas Gabino | $62,808 | |
| Previous Owner | Salinas Gabino | $63,913 |
Source: Public Records
Tax History Compared to Growth
Tax History
| Year | Tax Paid | Tax Assessment Tax Assessment Total Assessment is a certain percentage of the fair market value that is determined by local assessors to be the total taxable value of land and additions on the property. | Land | Improvement |
|---|---|---|---|---|
| 2025 | $2,039 | $189,320 | $59,606 | $129,714 |
| 2023 | $2,039 | $181,971 | $57,293 | $124,678 |
| 2022 | $1,985 | $178,404 | $56,170 | $122,234 |
| 2021 | $1,975 | $174,907 | $55,069 | $119,838 |
| 2020 | $1,955 | $173,115 | $54,505 | $118,610 |
| 2019 | $1,914 | $169,722 | $53,437 | $116,285 |
| 2018 | $1,080 | $96,663 | $44,271 | $52,392 |
| 2017 | $1,067 | $94,768 | $43,403 | $51,365 |
| 2016 | $1,051 | $92,910 | $42,552 | $50,358 |
| 2015 | $1,036 | $91,516 | $41,914 | $49,602 |
| 2014 | $967 | $89,725 | $41,094 | $48,631 |
Source: Public Records
Map
Nearby Homes
- 6088 Vista de Oro
- 4077 Riverview Dr
- 0 42nd St
- 5754 Tilton Ave
- 4598 Plaza Ln
- Plan 3 at Las Palmas
- Plan 2 at Las Palmas
- 6045 Mission Blvd Unit 13
- 6045 Mission Blvd Unit 44
- 6154 Mission Blvd Unit 55
- 6000 Limonite Ave
- 0 Mission Blvd Unit PW24252396
- 0 Mission Blvd Unit IV23139894
- 3715 Avalon St
- 6339 Rathke Dr
- 3350 Jennie St
- Ammolite Plan at Seasons at Sagebrush - Seasons Collection
- Elderberry Plan at Seasons at Sagebrush - Seasons Collection
- Tourmaline Plan at Seasons at Sagebrush - Seasons Collection
- Agate Plan at Seasons at Sagebrush - Seasons Collection
- 5856 De la Vista
- 5879 De la Vista
- 4257 Riverview Dr
- 5822 De la Vista
- 4281 Riverview Dr
- 5867 De la Vista
- 5855 De la Vista
- 5831 De la Vista
- 5910 De la Vista
- 4301 Riverview Dr
- 5811 De la Vista
- 5911 Vista de Oro
- 5928 De la Vista
- 4272 Riverview Dr
- 5911 De la Vista
- 4280 Riverview Dr
- 4264 Riverview Dr
- 5866 42nd St
- 5854 42nd St
- 5929 Vista de Oro