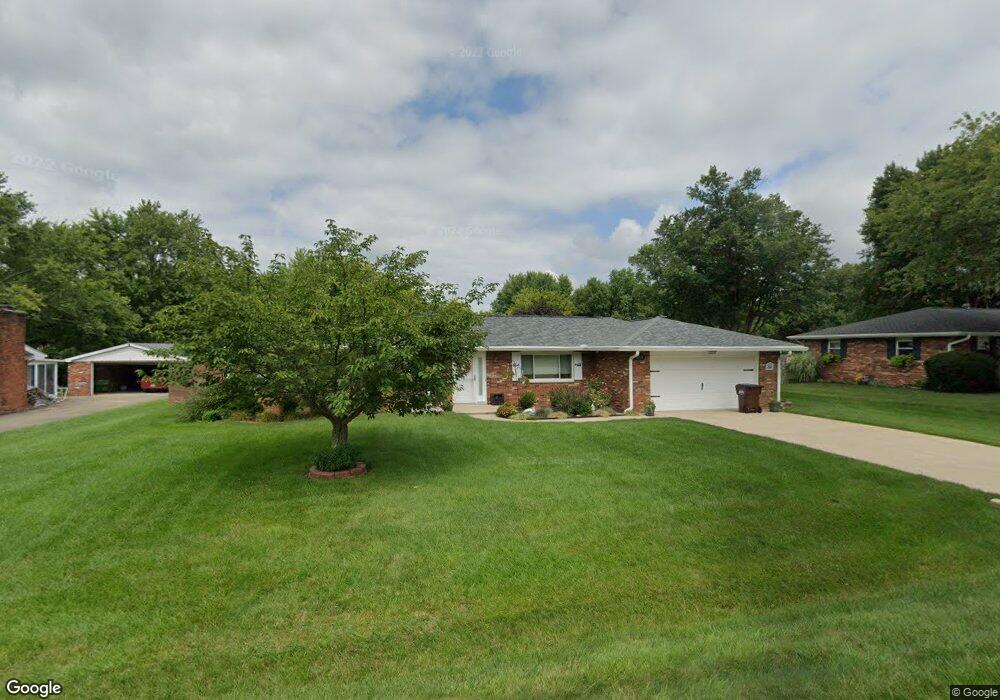
5868 Jaqui Ln Franklin, OH 45005
Estimated Value: $266,000 - $291,560
3
Beds
2
Baths
1,504
Sq Ft
$183/Sq Ft
Est. Value
About This Home
This home is located at 5868 Jaqui Ln, Franklin, OH 45005 and is currently estimated at $275,140, approximately $182 per square foot. 5868 Jaqui Ln is a home located in Warren County with nearby schools including Franklin High School, Summit Academy Community School for Alternative Learners - Middletown, and Summit Academy Secondary School - Middletown.
Ownership History
Date
Name
Owned For
Owner Type
Purchase Details
Closed on
Oct 17, 2022
Sold by
Lang Norbert H and Lang Jeana K
Bought by
Peters Debbie L
Current Estimated Value
Home Financials for this Owner
Home Financials are based on the most recent Mortgage that was taken out on this home.
Original Mortgage
$119,900
Interest Rate
5.89%
Mortgage Type
New Conventional
Purchase Details
Closed on
Nov 12, 2019
Sold by
Lang Norbert H
Bought by
Lang Norbert H and Lang Jeana K
Purchase Details
Closed on
Oct 20, 2011
Sold by
Hause Paula J and Estate Of Paul Edward Chaney
Bought by
Lang Norbert H
Home Financials for this Owner
Home Financials are based on the most recent Mortgage that was taken out on this home.
Original Mortgage
$112,766
Interest Rate
4.25%
Mortgage Type
FHA
Purchase Details
Closed on
Feb 15, 2006
Sold by
Estate Of Norma Jean Chaney
Bought by
Chaney Paul Edward and Chaney Paul E
Create a Home Valuation Report for This Property
The Home Valuation Report is an in-depth analysis detailing your home's value as well as a comparison with similar homes in the area
Home Values in the Area
Average Home Value in this Area
Purchase History
| Date | Buyer | Sale Price | Title Company |
|---|---|---|---|
| Peters Debbie L | $249,900 | Mattingly Ford Title | |
| Lang Norbert H | -- | None Available | |
| Lang Norbert H | $115,700 | Prodigy Title | |
| Chaney Paul Edward | -- | None Available |
Source: Public Records
Mortgage History
| Date | Status | Borrower | Loan Amount |
|---|---|---|---|
| Previous Owner | Peters Debbie L | $119,900 | |
| Previous Owner | Lang Norbert H | $112,766 |
Source: Public Records
Tax History Compared to Growth
Tax History
| Year | Tax Paid | Tax Assessment Tax Assessment Total Assessment is a certain percentage of the fair market value that is determined by local assessors to be the total taxable value of land and additions on the property. | Land | Improvement |
|---|---|---|---|---|
| 2024 | $3,492 | $78,630 | $16,010 | $62,620 |
| 2023 | $3,141 | $63,787 | $10,493 | $53,294 |
| 2022 | $2,508 | $51,947 | $10,493 | $41,454 |
| 2021 | $2,370 | $51,947 | $10,493 | $41,454 |
| 2020 | $2,284 | $44,023 | $8,894 | $35,130 |
| 2019 | $2,065 | $44,023 | $8,894 | $35,130 |
| 2018 | $1,663 | $44,023 | $8,894 | $35,130 |
| 2017 | $1,680 | $41,164 | $8,449 | $32,715 |
| 2016 | $1,715 | $41,164 | $8,449 | $32,715 |
| 2015 | $1,717 | $41,164 | $8,449 | $32,715 |
| 2014 | $1,724 | $41,020 | $8,450 | $32,570 |
| 2013 | $1,465 | $43,180 | $8,890 | $34,290 |
Source: Public Records
Map
Nearby Homes
- 60 Pleasant Hill Blvd
- 220 Pleasant Hill Blvd
- 25 Timber Creek Dr
- 0 Kathy Ln Unit 1834240
- 0 Kathy Ln Unit 930066
- 1117 S Main St
- 1010 S Main St
- 1007 S River St
- 5756 Union Rd
- 218 Roberts Ave
- 820 S River St
- 1200 Riley Blvd
- 6772 Rivulet Dr
- 5845 Manchester Rd
- 627 S River St
- 519 Anderson St
- 187 Minnick St
- 5696 Woodcreek Dr
- 521 S Main St
- 121 E 5th St