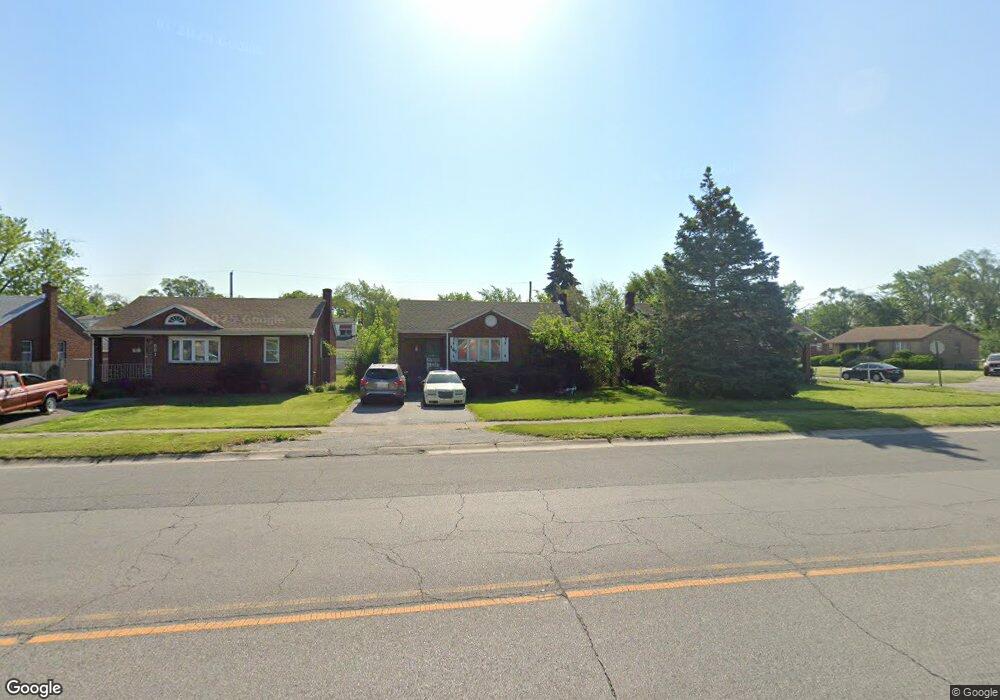
587 Chase St Gary, IN 46404
Ambridge-Mann NeighborhoodEstimated Value: $66,000 - $127,238
3
Beds
2
Baths
865
Sq Ft
$113/Sq Ft
Est. Value
About This Home
This home is located at 587 Chase St, Gary, IN 46404 and is currently estimated at $98,060, approximately $113 per square foot. 587 Chase St is a home located in Lake County with nearby schools including Beveridge Elementary School, Bailly Preparatory Academy, and West Side Leadership Academy.
Ownership History
Date
Name
Owned For
Owner Type
Purchase Details
Closed on
Feb 18, 2020
Sold by
Ace Nwi Llc
Bought by
La Te Da Investments Llc
Current Estimated Value
Home Financials for this Owner
Home Financials are based on the most recent Mortgage that was taken out on this home.
Original Mortgage
$40,000
Outstanding Balance
$35,190
Interest Rate
3.6%
Mortgage Type
Commercial
Estimated Equity
$62,870
Purchase Details
Closed on
Oct 31, 2008
Sold by
U S Bank Na
Bought by
Patterson Renee C
Purchase Details
Closed on
Jun 6, 2008
Sold by
Mengich Beatrice J and Property Asset Management Inc
Bought by
U S Bank Na and Structured Asset Investment Loan Trust 2
Purchase Details
Closed on
Feb 28, 2006
Sold by
Parker Kimaka and Parker Thawann
Bought by
Mengich Beatrice J
Home Financials for this Owner
Home Financials are based on the most recent Mortgage that was taken out on this home.
Original Mortgage
$62,100
Interest Rate
11.32%
Mortgage Type
Purchase Money Mortgage
Create a Home Valuation Report for This Property
The Home Valuation Report is an in-depth analysis detailing your home's value as well as a comparison with similar homes in the area
Home Values in the Area
Average Home Value in this Area
Purchase History
| Date | Buyer | Sale Price | Title Company |
|---|---|---|---|
| La Te Da Investments Llc | -- | Indiana Title Network Co | |
| Ace Nwi Llc | -- | Indiana Title Network Co | |
| Patterson Renee C | -- | Statewide Title Company Inc | |
| U S Bank Na | $34,160 | None Available | |
| Mengich Beatrice J | -- | Indiana Title Network Co |
Source: Public Records
Mortgage History
| Date | Status | Borrower | Loan Amount |
|---|---|---|---|
| Open | La Te Da Investments Llc | $40,000 | |
| Previous Owner | Mengich Beatrice J | $62,100 |
Source: Public Records
Tax History
| Year | Tax Paid | Tax Assessment Tax Assessment Total Assessment is a certain percentage of the fair market value that is determined by local assessors to be the total taxable value of land and additions on the property. | Land | Improvement |
|---|---|---|---|---|
| 2025 | $1,238 | $76,800 | $9,000 | $67,800 |
| 2024 | $4,117 | $48,100 | $8,700 | $39,400 |
| 2023 | $1,181 | $46,700 | $8,700 | $38,000 |
| 2022 | $1,181 | $44,600 | $5,700 | $38,900 |
| 2021 | $1,106 | $41,700 | $5,700 | $36,000 |
| 2020 | $1,106 | $41,700 | $5,700 | $36,000 |
| 2019 | $971 | $42,000 | $5,700 | $36,300 |
| 2018 | $1,103 | $45,800 | $5,700 | $40,100 |
| 2017 | $1,097 | $46,200 | $5,700 | $40,500 |
| 2016 | $1,121 | $48,000 | $5,700 | $42,300 |
| 2014 | $1,473 | $61,300 | $7,000 | $54,300 |
| 2013 | $1,377 | $59,600 | $7,000 | $52,600 |
Source: Public Records
Map
Nearby Homes
- 541 Chase St
- 3911 W 10th Ave
- 541 Taft Place
- 418 Taft St
- 2357 W 9th Ave
- 357 Taft Place
- 263 Rutledge St
- 1139 Taney St
- 200 Taft Place
- 1150 Jennings St
- 2006 W 4th Place
- 1125 Wallace St
- 1330 Taney Place
- 2243 W 10th Place
- 419 Cleveland St
- 1166 Noble St
- 314 Cleveland St
- 1122 Bigger St
- 1046 W Taft St
- 1035 Willard St
Your Personal Tour Guide
Ask me questions while you tour the home.