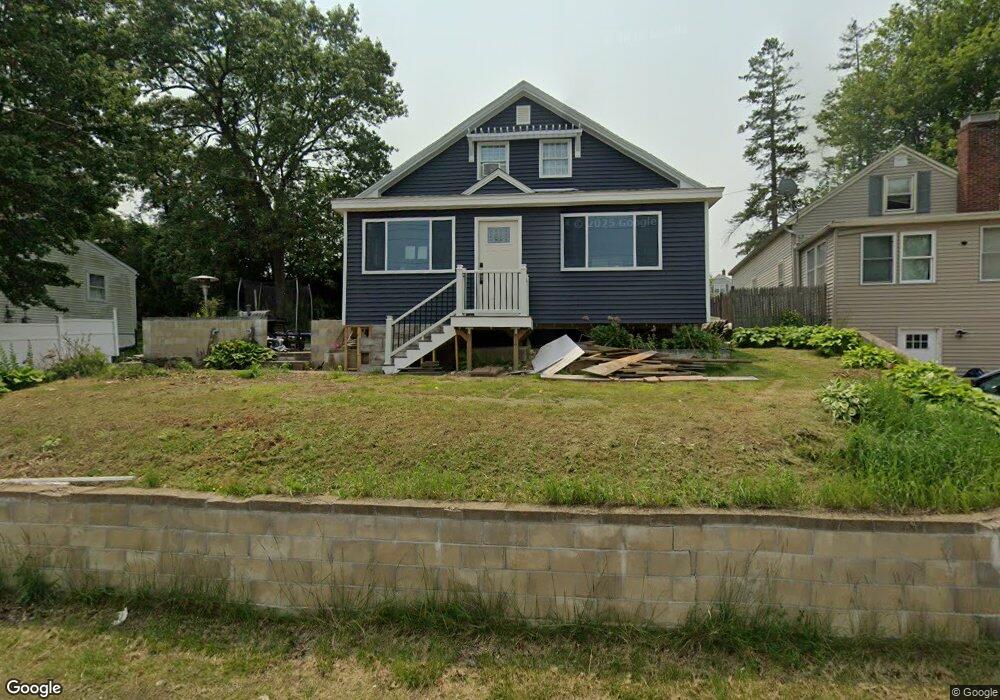
587 S Main St Nashua, NH 03060
Southeast Nashua NeighborhoodEstimated Value: $486,000 - $523,000
4
Beds
3
Baths
1,556
Sq Ft
$319/Sq Ft
Est. Value
About This Home
This home is located at 587 S Main St, Nashua, NH 03060 and is currently estimated at $496,794, approximately $319 per square foot. 587 S Main St is a home located in Hillsborough County with nearby schools including Sunset Heights Elementary School, Elm Street Middle School, and Nashua High School South.
Ownership History
Date
Name
Owned For
Owner Type
Purchase Details
Closed on
Jul 3, 2007
Sold by
Sg Mortgage Securities
Bought by
Son Thi
Current Estimated Value
Home Financials for this Owner
Home Financials are based on the most recent Mortgage that was taken out on this home.
Original Mortgage
$200,848
Interest Rate
6.24%
Mortgage Type
Purchase Money Mortgage
Purchase Details
Closed on
Jan 16, 2007
Sold by
Rittenberg Matthew D and Rittenberg Laurie L
Bought by
Sg Mtg Securities T
Purchase Details
Closed on
Jul 13, 1999
Sold by
Tedder Peter A and Tedder Rita M
Bought by
Rittenberg Matthew D and Rittenberg Laurie L
Home Financials for this Owner
Home Financials are based on the most recent Mortgage that was taken out on this home.
Original Mortgage
$114,018
Interest Rate
7.19%
Mortgage Type
Purchase Money Mortgage
Create a Home Valuation Report for This Property
The Home Valuation Report is an in-depth analysis detailing your home's value as well as a comparison with similar homes in the area
Home Values in the Area
Average Home Value in this Area
Purchase History
| Date | Buyer | Sale Price | Title Company |
|---|---|---|---|
| Son Thi | $204,000 | -- | |
| Sg Mtg Securities T | $211,700 | -- | |
| Rittenberg Matthew D | $123,900 | -- |
Source: Public Records
Mortgage History
| Date | Status | Borrower | Loan Amount |
|---|---|---|---|
| Open | Rittenberg Matthew D | $203,860 | |
| Closed | Rittenberg Matthew D | $200,848 | |
| Previous Owner | Rittenberg Matthew D | $238,000 | |
| Previous Owner | Rittenberg Matthew D | $114,018 |
Source: Public Records
Tax History Compared to Growth
Tax History
| Year | Tax Paid | Tax Assessment Tax Assessment Total Assessment is a certain percentage of the fair market value that is determined by local assessors to be the total taxable value of land and additions on the property. | Land | Improvement |
|---|---|---|---|---|
| 2024 | $6,408 | $403,000 | $135,900 | $267,100 |
| 2023 | $6,308 | $346,000 | $108,700 | $237,300 |
| 2022 | $6,252 | $346,000 | $108,700 | $237,300 |
| 2021 | $5,194 | $223,700 | $72,500 | $151,200 |
| 2020 | $5,058 | $223,700 | $72,500 | $151,200 |
| 2019 | $4,868 | $223,700 | $72,500 | $151,200 |
| 2018 | $4,745 | $223,700 | $72,500 | $151,200 |
| 2017 | $4,312 | $167,200 | $70,000 | $97,200 |
| 2016 | $4,192 | $167,200 | $70,000 | $97,200 |
| 2015 | $4,101 | $167,200 | $70,000 | $97,200 |
| 2014 | $4,021 | $167,200 | $70,000 | $97,200 |
Source: Public Records
Map
Nearby Homes
- 130 E Hobart St Unit 85
- 61 Spindlewick Dr
- 160 Daniel Webster Hwy Unit 328
- 4 Autumn Leaf Dr Unit 8
- 36 Eastman St Unit 26
- 9 Byron Dr
- 73 Bluestone Dr
- 15 Learned St Unit 123
- 92 Bluestone Dr
- 17 Herrick St
- 6 Hayden St
- 5 Louisburg Square Unit 11
- 125 Lille Rd
- 27 Fifield St Unit 13
- 1 Circle Ave
- 7 Hickory St
- 29 Dickens St
- 5 Appaloosa Place
- 63 Dexter St
- 15 Lovell St Unit 3
- 2 W Hobart St
- 589 S Main St
- 4 W Hobart St Unit 4
- 588 S Main St
- 588 S Main St Unit 3
- 591 S Main St
- 583 S Main St
- 5 W Hobart St Unit 57
- 10 W Hobart St
- 582 S Main St
- 1 E Hobart St
- 592 S Main St
- 9 W Hobart St Unit 55
- 7 W Glenwood St
- 6 E Hobart St
- 11 E Hobart St
- 580 S Main St
- 12 W Hobart St
- 593A S Main St Unit A
- 593 S Main St Unit B